Overstock.com 2009 Annual Report Download - page 63
Download and view the complete annual report
Please find page 63 of the 2009 Overstock.com annual report below. You can navigate through the pages in the report by either clicking on the pages listed below, or by using the keyword search tool below to find specific information within the annual report.-
 1
1 -
2
-
3
-
4
-
5
-
6
-
7
-
8
-
9
-
10
-
11
-
12
-
13
-
14
-
15
-
16
-
17
-
18
-
19
-
20
-
21
-
22
-
23
-
24
-
25
-
26
-
27
-
28
-
29
-
30
-
31
-
32
-
33
-
34
-
35
-
36
-
37
-
38
-
39
-
40
-
41
-
42
-
43
-
44
-
45
-
46
-
47
-
48
-
49
-
50
-
51
-
52
-
 53
53 -
 54
54 -
 55
55 -
 56
56 -
 57
57 -
 58
58 -
 59
59 -
 60
60 -
 61
61 -
 62
62 -
 63
63 -
 64
64 -
 65
65 -
 66
66 -
 67
67 -
 68
68 -
 69
69 -
 70
70 -
 71
71 -
 72
72 -
 73
73 -
74
-
75
-
76
-
77
-
78
-
79
-
80
-
81
-
82
-
83
-
84
-
85
-
86
-
87
-
88
-
89
-
90
-
91
-
92
-
93
-
94
-
95
-
96
-
97
-
98
-
99
-
100
-
101
-
102
-
103
-
104
-
105
-
106
-
107
-
108
-
109
-
110
-
111
-
112
-
113
-
114
-
115
-
116
-
117
-
118
-
119
-
120
-
121
-
122
-
123
-
124
-
125
-
126
-
127
-
128
-
129
-
130
-
131
-
132
-
133
-
134
-
135
-
136
-
137
-
138
-
139
-
140
-
141
-
142
-
143
-
144
-
145
-
146
-
147
-
148
-
149
-
150
-
151
-
152
-
153
-
154
-
155
-
156
-
157
-
158
-
159
-
160
-
161
-
162
-
163
-
164
-
165
-
166
-
167
-
168
 |
 |

Table of Contents
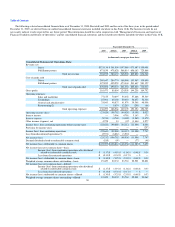
Restricted stock units
During the year ended December 31, 2009, we granted a total of 366,000 restricted stock units to employees. The restricted stock units vest over three
years at 25% at the end of the first year, 25% at the end of the second year and 50% at the end of the third year, and are subject to the employee's continuing
service to us. At December, 2009, there were 640,000 un-vested restricted stock units that remained outstanding.
The cost of restricted stock units is determined using the fair value of our shares of common stock on the date of the grant and compensation expense is
recognized straight line over the three year vesting schedule. (see Item 15 of Part IV, "Financial Statements"—Note 20—"Stock-Based Awards").
Loss contingencies
In the normal course of business, we are involved in legal proceedings and other potential contingencies. We accrue a liability for such matters when it is
probable that a loss has been incurred and the amount can be reasonably estimated. When only a range of possible loss can be established, the most probable
amount in the range is accrued. If no amount within this range is a better estimate than any other amount within the range, the minimum amount in the range
is accrued.
Accounting pronouncements issued not yet adopted
See Item 15 of Part IV, "Financial Statements"—Note 2—"Accounting Policies" subheading "Accounting Pronouncements Issued Not Yet Adopted."
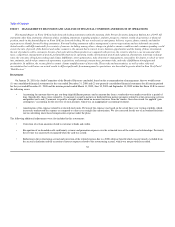
Executive Commentary
This executive commentary is intended to provide investors with a view of our business through the eyes of our management. As an executive
commentary, it necessarily focuses on selected aspects of our business. This executive commentary is intended as a supplement to, but not a substitute for, the
more detailed discussion of our business included elsewhere herein. Investors are cautioned to read our entire "Management's Discussion and Analysis of
Financial Condition and Results of Operations", as well as our interim and audited financial statements, and the discussion of our business and risk factors
and other information included elsewhere in this report. This executive commentary includes forward-looking statements, and investors are cautioned to read
the "Special Note Regarding Forward-Looking Statements" included elsewhere in this report.
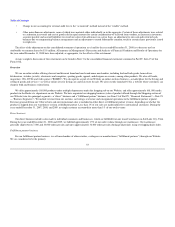
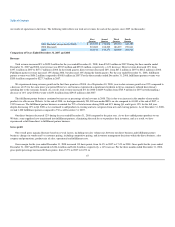
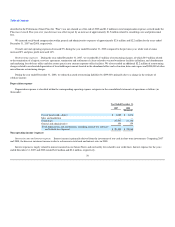
Revenue grew 27% in the fourth quarter of 2009 and 6% for the full year of 2009, compared to the same periods of 2008, in spite of the weakness in the
overall US economy. Our business model continues to mature. Through expanding the number of partners we work with, and the number of categories and
products we offer on our Website, the fulfillment partner business now generates over 80% of our revenue. Our direct business, which accounted for over
40% of total revenues in 2005, has contributed a consistently smaller percentage of total revenues over the last five years as our emphasis has shifted to the
fulfillment partner business. In 2009, the direct business generated 17% of total revenue.
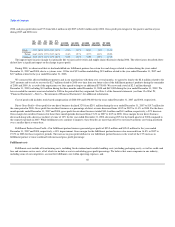
We have marketing and pricing initiatives that are attracting shoppers to our Website. While pricing initiatives create pressure on gross profit, we have
been able to offset part of this pressure on gross profit through strong revenue growth and supply chain efficiencies. Marketing expense as a percent of
revenue was the lowest it has been in our history. We believe that we have used relatively effective advertising campaigns and maintained a disciplined
approach to marketing expenditures. As a result of increased gross profit and controlled spending on advertising, we saw a 26% growth in 2009 contribution
(which is gross profit less marketing expense), while our operating expenses increased by
60