Overstock.com 2009 Annual Report Download - page 104
Download and view the complete annual report
Please find page 104 of the 2009 Overstock.com annual report below. You can navigate through the pages in the report by either clicking on the pages listed below, or by using the keyword search tool below to find specific information within the annual report.-
 1
1 -
2
-
3
-
4
-
5
-
6
-
7
-
8
-
9
-
10
-
11
-
12
-
13
-
14
-
15
-
16
-
17
-
18
-
19
-
20
-
21
-
22
-
23
-
24
-
25
-
26
-
27
-
28
-
29
-
30
-
31
-
32
-
33
-
34
-
35
-
36
-
37
-
38
-
39
-
40
-
41
-
42
-
43
-
44
-
45
-
46
-
47
-
48
-
49
-
50
-
51
-
52
-
53
-
54
-
55
-
56
-
57
-
58
-
59
-
60
-
61
-
62
-
63
-
64
-
65
-
66
-
67
-
68
-
69
-
70
-
71
-
72
-
73
-
74
-
75
-
76
-
77
-
78
-
79
-
80
-
81
-
82
-
83
-
84
-
85
-
86
-
87
-
88
-
89
-
90
-
91
-
92
-
93
-
 94
94 -
 95
95 -
 96
96 -
 97
97 -
 98
98 -
 99
99 -
 100
100 -
 101
101 -
 102
102 -
 103
103 -
 104
104 -
 105
105 -
 106
106 -
 107
107 -
 108
108 -
 109
109 -
 110
110 -
 111
111 -
 112
112 -
 113
113 -
 114
114 -
115
-
116
-
117
-
118
-
119
-
120
-
121
-
122
-
123
-
124
-
125
-
126
-
127
-
128
-
129
-
130
-
131
-
132
-
133
-
134
-
135
-
136
-
137
-
138
-
139
-
140
-
141
-
142
-
143
-
144
-
145
-
146
-
147
-
148
-
149
-
150
-
151
-
152
-
153
-
154
-
155
-
156
-
157
-
158
-
159
-
160
-
161
-
162
-
163
-
164
-
165
-
166
-
167
-
168
 |
 |

Table of Contents
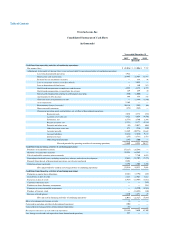
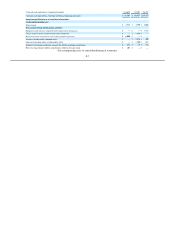
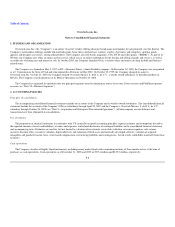
Overstock.com, Inc.
Notes to Consolidated Financial Statements (Continued)
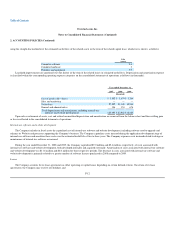
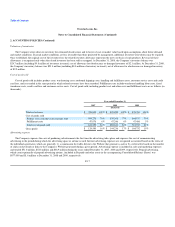
2. ACCOUNTING POLICIES (Continued)
The fair value of these financial instruments was determined using the following levels of inputs as of December 31, 2008 (in thousands):
Fair Value Measurements
as of December 31, 2008:
Total Level 1 Level 2 Level 3
Assets:
Cash equivalents and restricted cash—Money market
mutual funds $101,678 $101,678 $ — $ —
Available-for-sale-securities 8,989 8,989 — —
Total assets $110,667 $110,667 $ — $ —
The fair value of these financial instruments was determined using the following levels of inputs as of December 31, 2009 (in thousands):
Fair Value Measurements
as of December 31, 2009:
Total Level 1 Level 2 Level 3
Assets:
Cash equivalents and restricted cash—Money market
mutual funds $133,583 $133,583 $ — $ —
Liabilities:
Restructuring accrual(1) $ 2,685 $ — $ — $2,685
The fair value was determined based on the income approach, in which the Company used internal cash flow
projections over the life of the underlying lease agreements discounted based on a credit adjusted risk-free rate of
return. See the Level 3 roll forward related to the restructuring accrual at Note 4—Restructuring Expense.
(1)
The estimated fair value of the Company's 3.75% Convertible Senior Notes due 2011 ("Senior Notes") outstanding at December 31, 2008 and
December 31, 2009 was $38.1 million on a carrying value of $66.6 million and $53.6 million on a carrying value of $59.5 million, respectively. The fair value
of the Senior Notes was derived using a convertible debt pricing model with observable market inputs, which include stock price, dividend payments,
borrowing costs, equity volatility, interest rates and interest spread.
Accounts receivable
Accounts receivable consist principally of trade amounts due from customers and from uncleared credit card transactions at period end. Accounts
receivable are recorded at invoiced amounts and do not bear interest.
Allowance for doubtful accounts
From time to time, the Company grants credit to some of its business customers on normal credit terms (typically 30 days). The Company performs
credit evaluations of its customers' financial condition
F-10