Overstock.com 2009 Annual Report Download - page 72
Download and view the complete annual report
Please find page 72 of the 2009 Overstock.com annual report below. You can navigate through the pages in the report by either clicking on the pages listed below, or by using the keyword search tool below to find specific information within the annual report.-
 1
1 -
2
-
3
-
4
-
5
-
6
-
7
-
8
-
9
-
10
-
11
-
12
-
13
-
14
-
15
-
16
-
17
-
18
-
19
-
20
-
21
-
22
-
23
-
24
-
25
-
26
-
27
-
28
-
29
-
30
-
31
-
32
-
33
-
34
-
35
-
36
-
37
-
38
-
39
-
40
-
41
-
42
-
43
-
44
-
45
-
46
-
47
-
48
-
49
-
50
-
51
-
52
-
53
-
54
-
55
-
56
-
57
-
58
-
59
-
60
-
61
-
 62
62 -
 63
63 -
 64
64 -
 65
65 -
 66
66 -
 67
67 -
 68
68 -
 69
69 -
 70
70 -
 71
71 -
 72
72 -
 73
73 -
 74
74 -
 75
75 -
 76
76 -
 77
77 -
 78
78 -
 79
79 -
 80
80 -
 81
81 -
 82
82 -
83
-
84
-
85
-
86
-
87
-
88
-
89
-
90
-
91
-
92
-
93
-
94
-
95
-
96
-
97
-
98
-
99
-
100
-
101
-
102
-
103
-
104
-
105
-
106
-
107
-
108
-
109
-
110
-
111
-
112
-
113
-
114
-
115
-
116
-
117
-
118
-
119
-
120
-
121
-
122
-
123
-
124
-
125
-
126
-
127
-
128
-
129
-
130
-
131
-
132
-
133
-
134
-
135
-
136
-
137
-
138
-
139
-
140
-
141
-
142
-
143
-
144
-
145
-
146
-
147
-
148
-
149
-
150
-
151
-
152
-
153
-
154
-
155
-
156
-
157
-
158
-
159
-
160
-
161
-
162
-
163
-
164
-
165
-
166
-
167
-
168
 |
 |

Table of Contents
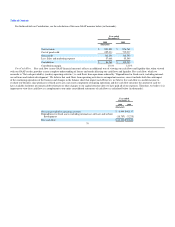
therefore exclude fulfillment costs from gross profit percentage. As a result, our gross profit percentage may not be directly comparable to others in our
industry.
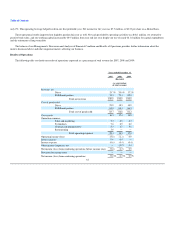
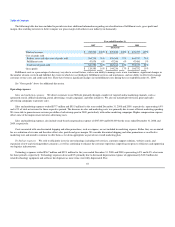
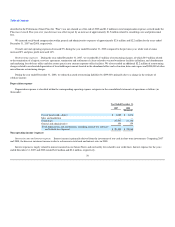
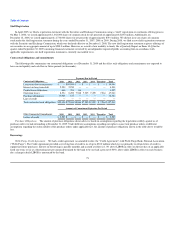
The following table has been included to provide investors additional information regarding our classification of fulfillment costs and gross profit
percentage, thus enabling investors to better compare our gross profit percentage with others in our industry (in thousands):
Years ended December 31,
2007 2008
(Restated)
Total net revenue $ 765,902 100% $ 829,850 100%
Cost of goods sold
Product costs and other cost of goods sold 594,276 78% 638,368 77%
Fulfillment costs 47,076 6% 47,246 6%
Total cost of goods sold 641,352 84% 685,614 83%
Gross profit $ 124,550 16% $ 144,236 17%
Fulfillment costs as a percentage of sales may vary due to several factors, such as our ability to manage costs at our warehouses, significant changes in
the number of units received and fulfilled, the extent to which we utilize third party fulfillment services and warehouses, and our ability to effectively manage
customer service costs and credit card fees.
Operating expenses
Sales and marketing. Sales and marketing expenses totaled $55.5 million and $57.7 million for the years ended December 31, 2007 and 2008,
representing 7% of total revenue for those respective periods, and a 4% increase from 2007 to 2008. We direct customers to our Website primarily through a
number of targeted online marketing channels, such as sponsored search, affiliate marketing, portal advertising, e-mail campaigns, and other initiatives. We
also use nation-wide television, print and radio advertising campaigns to promote sales. Sales and marketing expenses also include stock-based compensation
of $336,000 and $347,000 for the years ended December 31, 2007 and 2008, respectively.
Costs associated with our discounted shipping promotions are not included in marketing expense. Rather they are accounted for as a reduction of revenue
and therefore affect sales growth and gross profit percentage. We consider discounted shipping promotions as an effective marketing tool, and intend to
continue to offer them as we deem appropriate as part of our overall marketing plan.
Technology expenses. We seek to efficiently invest in our technology, including web services, customer support, search, and expansion of new and
existing product categories, as well as technology infrastructure to continue to enhance the customer experience, improve our process efficiency and support
our web services infrastructure.
Technology expenses totaled $59.5 million and $56.7 million for the years ended December 31, 2007 and 2008, respectively (7.8% and 6.9% of revenue
for 2007 and 2008). From 2007 to 2008, technology expenses decreased 5% primarily due to decreased depreciation expense. Technology expenses also
included stock-based compensation of $764,000 and $870,000 for the years ended December 31, 2007 and 2008, respectively.
General and administrative expenses. General and administrative ("G&A") expenses totaled $42.0 million and $39.3 million for the years ended
December 31, 2007 and 2008, respectively, representing approximately 5.5% and 4.7% of total revenue. The decrease in G&A expenses is primarily due to a
$4.1 million decrease in bonuses accrued in 2008 (including our decision to not pay senior executives and company-wide profit sharing bonuses). In addition,
the performance goal
69