Overstock.com 2009 Annual Report Download - page 119
Download and view the complete annual report
Please find page 119 of the 2009 Overstock.com annual report below. You can navigate through the pages in the report by either clicking on the pages listed below, or by using the keyword search tool below to find specific information within the annual report.-
 1
1 -
2
-
3
-
4
-
5
-
6
-
7
-
8
-
9
-
10
-
11
-
12
-
13
-
14
-
15
-
16
-
17
-
18
-
19
-
20
-
21
-
22
-
23
-
24
-
25
-
26
-
27
-
28
-
29
-
30
-
31
-
32
-
33
-
34
-
35
-
36
-
37
-
38
-
39
-
40
-
41
-
42
-
43
-
44
-
45
-
46
-
47
-
48
-
49
-
50
-
51
-
52
-
53
-
54
-
55
-
56
-
57
-
58
-
59
-
60
-
61
-
62
-
63
-
64
-
65
-
66
-
67
-
68
-
69
-
70
-
71
-
72
-
73
-
74
-
75
-
76
-
77
-
78
-
79
-
80
-
81
-
82
-
83
-
84
-
85
-
86
-
87
-
88
-
89
-
90
-
91
-
92
-
93
-
94
-
95
-
96
-
97
-
98
-
99
-
100
-
101
-
102
-
103
-
104
-
105
-
106
-
107
-
108
-
 109
109 -
 110
110 -
 111
111 -
 112
112 -
 113
113 -
 114
114 -
 115
115 -
 116
116 -
 117
117 -
 118
118 -
 119
119 -
 120
120 -
 121
121 -
 122
122 -
 123
123 -
 124
124 -
 125
125 -
 126
126 -
 127
127 -
 128
128 -
 129
129 -
130
-
131
-
132
-
133
-
134
-
135
-
136
-
137
-
138
-
139
-
140
-
141
-
142
-
143
-
144
-
145
-
146
-
147
-
148
-
149
-
150
-
151
-
152
-
153
-
154
-
155
-
156
-
157
-
158
-
159
-
160
-
161
-
162
-
163
-
164
-
165
-
166
-
167
-
168
 |
 |

Table of Contents
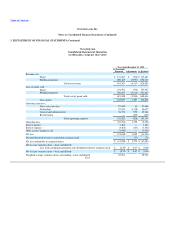
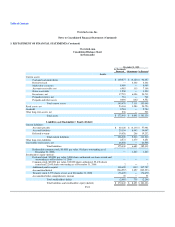
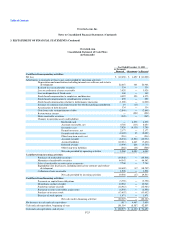
Overstock.com, Inc.
Notes to Consolidated Financial Statements (Continued)
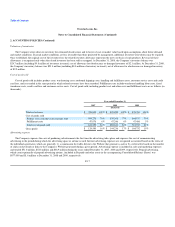
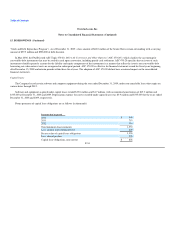
3. RESTATEMENT OF FINANCIAL STATEMENTS (Continued)
Overstock.com
Consolidated Statement of Cash Flows
(in thousands)
Year Ended December 31, 2008
As Previously
Reported Adjustments As Restated
Cash flows from operating activities:
Net loss $ (12,658) $ 1,652 $ (11,006)
Adjustments to reconcile net loss to net cash provided by operating activities:
Depreciation and amortization, including internal-use software and website
development 22,667 301 22,968
Realized loss on marketable securities 334 — 334
Loss on settlement of notes receivable 3,929 — 3,929
Loss on disposition of fixed assets 140 — 140
Stock-based compensation to employees and directors 4,022 350 4,372
Stock-based compensation to consultants for services 259 — 259
Stock-based compensation relating to performance share plan (1,000) — (1,000)
Issuance of common stock from treasury for 401(k) matching contribution 19 (19) —
Amortization of debt discount 334 — 334
Gain from early extinguishment of debt (2,849) — (2,849)
Restructuring charges — (299) (299)
Notes receivable accretion (545) — (545)
Changes in operating assets and liabilities:
Restricted cash — 4,372 4,372
Accounts receivable, net 4,769 (115) 4,654
Inventories, net 7,920 (4,130) 3,790
Prepaid inventory, net 2,177 — 2,177
Prepaids and other assets (2,122) 95 (2,027)
Other long-term assets, net (516) — (516)
Accounts payable (8,238) (2,536) (10,774)
Accrued liabilities (12,281) 4,645 (7,636)
Deferred revenue (3,939) 206 (3,733)
Other long-term liabilities (462) (38) (500)
Net cash provided by operating activities 1,960 4,484 6,444
Cash flows from investing activities:
Purchases of marketable securities (35,548) — (35,548)
Maturities of marketable securities 64,542 — 64,542
Sales of marketable securities prior to maturity 7,740 — 7,740
Expenditures for fixed assets, including internal-use software and website
development (18,690) (17) (18,707)
Collection of note receivable 1,506 — 1,506
Net cash provided by investing activities 19,550 (17) 19,533
Cash flows from financing activities:
Payments on capital lease obligations (3,796) — (3,796)
Drawdowns on line of credit 12,963 — 12,963
Paydowns on line of credit (12,963) — (12,963)
Payments to retire convertible senior notes (6,550) — (6,550)
Purchase of treasury stock (13,452) — (13,452)
Exercise of stock options 1,471 — 1,471
Net cash used in financing activities (22,327) — (22,327)
Net decrease in cash and cash equivalents (817) 4,467 3,650
Cash and cash equivalents, beginning of year 101,394 (8,587) 92,807
Cash and cash equivalents, end of year $ 100,577 $ (4,120) $ 96,457
F-25