Overstock.com 2009 Annual Report Download - page 117
Download and view the complete annual report
Please find page 117 of the 2009 Overstock.com annual report below. You can navigate through the pages in the report by either clicking on the pages listed below, or by using the keyword search tool below to find specific information within the annual report.-
 1
1 -
2
-
3
-
4
-
5
-
6
-
7
-
8
-
9
-
10
-
11
-
12
-
13
-
14
-
15
-
16
-
17
-
18
-
19
-
20
-
21
-
22
-
23
-
24
-
25
-
26
-
27
-
28
-
29
-
30
-
31
-
32
-
33
-
34
-
35
-
36
-
37
-
38
-
39
-
40
-
41
-
42
-
43
-
44
-
45
-
46
-
47
-
48
-
49
-
50
-
51
-
52
-
53
-
54
-
55
-
56
-
57
-
58
-
59
-
60
-
61
-
62
-
63
-
64
-
65
-
66
-
67
-
68
-
69
-
70
-
71
-
72
-
73
-
74
-
75
-
76
-
77
-
78
-
79
-
80
-
81
-
82
-
83
-
84
-
85
-
86
-
87
-
88
-
89
-
90
-
91
-
92
-
93
-
94
-
95
-
96
-
97
-
98
-
99
-
100
-
101
-
102
-
103
-
104
-
105
-
106
-
 107
107 -
 108
108 -
 109
109 -
 110
110 -
 111
111 -
 112
112 -
 113
113 -
 114
114 -
 115
115 -
 116
116 -
 117
117 -
 118
118 -
 119
119 -
 120
120 -
 121
121 -
 122
122 -
 123
123 -
 124
124 -
 125
125 -
 126
126 -
 127
127 -
128
-
129
-
130
-
131
-
132
-
133
-
134
-
135
-
136
-
137
-
138
-
139
-
140
-
141
-
142
-
143
-
144
-
145
-
146
-
147
-
148
-
149
-
150
-
151
-
152
-
153
-
154
-
155
-
156
-
157
-
158
-
159
-
160
-
161
-
162
-
163
-
164
-
165
-
166
-
167
-
168
 |
 |

Table of Contents
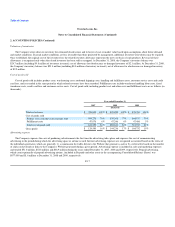
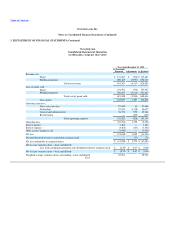
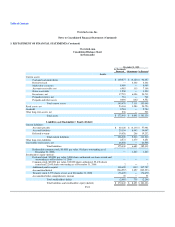
Overstock.com, Inc.
Notes to Consolidated Financial Statements (Continued)
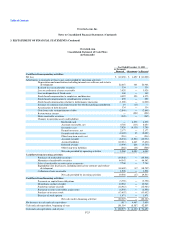
3. RESTATEMENT OF FINANCIAL STATEMENTS (Continued)
Overstock.com
Consolidated Statement of Operations
(in thousands, except per share data)
Year ended December 31, 2008
As Previously
Reported Adjustments As Restated
Revenue, net
Direct $ 174,203 $ (516) $ 173,687
Fulfillment partner 660,164 (4,001) 656,163
Total net revenue 834,367 (4,517) 829,850
Cost of goods sold
Direct 154,501 (534) 153,967
Fulfillment partner 536,957 (5,310) 531,647
Total cost of goods sold 691,458 (5,844) 685,614
Gross profit 142,909 1,327 144,236
Operating expenses:
Sales and marketing 57,634 34 57,668
Technology 57,815 (1,138) 56,677
General and administrative 38,373 975 39,348
Restructuring — (299) (299)
Total operating expenses 153,822 (428) 153,394
Operating loss (10,913) 1,755 (9,158)
Interest income 3,163 — 3,163
Interest expense (3,462) (103) (3,565)
Other income (expense), net (1,446) — (1,446)
Net loss (12,658) 1,652 (11,006)
Deemed dividend related to redeemable common stock — (77) (77)
Net loss attributable to common shares $ (12,658) $ 1,575 $ (11,083)
Net loss per common share—basic and diluted:
Loss from continuing operations after dividend realted to common stock $ (0.55) $ 0.07 $ (0.48)
Net loss per common share—basic and diluted $ (0.55) $ 0.07 $ (0.48)
Weighted average common shares outstanding—basic and diluted 22,901 22,901
F-23