Logitech 2011 Annual Report Download - page 232
Download and view the complete annual report
Please find page 232 of the 2011 Logitech annual report below. You can navigate through the pages in the report by either clicking on the pages listed below, or by using the keyword search tool below to find specific information within the annual report.-
 1
1 -
2
-
3
-
4
-
5
-
6
-
7
-
8
-
9
-
10
-
11
-
12
-
13
-
14
-
15
-
16
-
17
-
18
-
19
-
20
-
21
-
22
-
23
-
24
-
25
-
26
-
27
-
28
-
29
-
30
-
31
-
32
-
33
-
34
-
35
-
36
-
37
-
38
-
39
-
40
-
41
-
42
-
43
-
44
-
45
-
46
-
47
-
48
-
49
-
50
-
51
-
52
-
53
-
54
-
55
-
56
-
57
-
58
-
59
-
60
-
61
-
62
-
63
-
64
-
65
-
66
-
67
-
68
-
69
-
70
-
71
-
72
-
73
-
74
-
75
-
76
-
77
-
78
-
79
-
80
-
81
-
82
-
83
-
84
-
85
-
86
-
87
-
88
-
89
-
90
-
91
-
92
-
93
-
94
-
95
-
96
-
97
-
98
-
99
-
100
-
101
-
102
-
103
-
104
-
105
-
106
-
107
-
108
-
109
-
110
-
111
-
112
-
113
-
114
-
115
-
116
-
117
-
118
-
119
-
120
-
121
-
122
-
123
-
124
-
125
-
126
-
127
-
128
-
129
-
130
-
131
-
132
-
133
-
134
-
135
-
136
-
137
-
138
-
139
-
140
-
141
-
142
-
143
-
144
-
145
-
146
-
147
-
148
-
149
-
150
-
151
-
152
-
153
-
154
-
155
-
156
-
157
-
158
-
159
-
160
-
161
-
162
-
163
-
164
-
165
-
166
-
167
-
168
-
169
-
170
-
171
-
172
-
173
-
174
-
175
-
176
-
177
-
178
-
179
-
180
-
181
-
182
-
183
-
184
-
185
-
186
-
187
-
188
-
189
-
190
-
191
-
192
-
193
-
194
-
195
-
196
-
197
-
198
-
199
-
200
-
201
-
202
-
203
-
204
-
205
-
206
-
207
-
208
-
209
-
210
-
211
-
212
-
213
-
214
-
215
-
216
-
217
-
218
-
219
-
220
-
221
-
 222
222 -
 223
223 -
 224
224 -
 225
225 -
 226
226 -
 227
227 -
 228
228 -
 229
229 -
 230
230 -
 231
231 -
 232
232 -
 233
233 -
 234
234 -
 235
235 -
 236
236 -
 237
237 -
 238
238 -
 239
239 -
 240
240 -
 241
241 -
 242
242 -
243
-
244
-
245
-
246
-
247
-
248
-
249
-
250
-
251
-
252
-
253
-
254
-
255
-
256
 |
 |

220
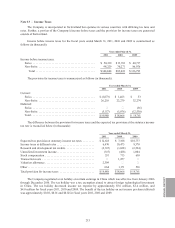
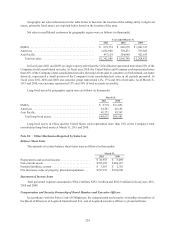
Note 15 — Commitments and Contingencies
Operating Leases
The Company leases facilities under operating leases, certain of which require it to pay property taxes,
insurance and maintenance costs. Operating leases for facilities are generally renewable at the Company’s option
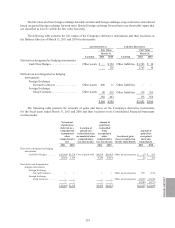
and usually include escalation clauses linked to inflation. Future minimum annual rentals under non-cancelable
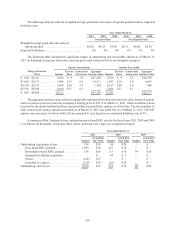
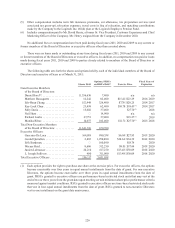
operating leases at March 31, 2011 are as follows (in thousands):
Year ending March 31,
2012 .................................................................. $18,023
2013 .................................................................. 15,594
2014 .................................................................. 9,875
2015 .................................................................. 7,870
2016 .................................................................. 6,962
Thereafter.............................................................. 14,267
$72,591
Rent expense was $19.8 million, $16.3 million and $15.5 million for the years ended March 31, 2011, 2010
and 2009.
In May, 2011 we signed a new lease for facilities which will house our Americas operations in Northern
California, replacing our leased facilities in Fremont, California. Our future contractual obligation in connection
with this lease is approximately $35 million over an 11 year period.
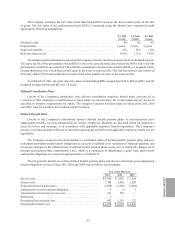
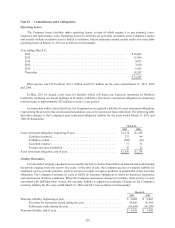
In connection with its leased facilities, the Company has recognized a liability for asset retirement obligations
representing the present value of estimated remediation costs to be incurred at lease expiration. The following table
describes changes to the Company’s asset retirement obligation liability for the years ended March 31, 2011 and
2010 (in thousands):
March 31,
2011 2010
Asset retirement obligation, beginning of year . . . . . . . . . . . . . . . . . . . . . . . . . . . . $1,374 $1,255
Liabilities incurred ............................................ 275 44
Liabilities settled .............................................. (120)(18)
Accretion expense ............................................. 71 71
Foreign currency translation ..................................... 36 22
Asset retirement obligation, end of year. . . . . . . . . . . . . . . . . . . . . . . . . . . . . . . . . . $1,636 $1,374
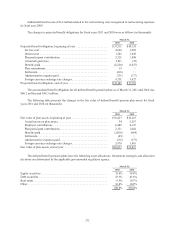
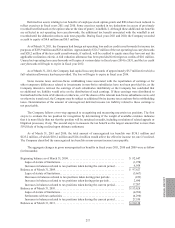
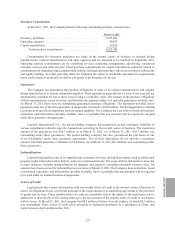
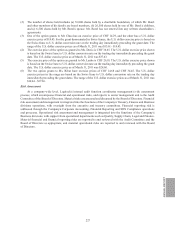
Product Warranties
Certain of the Company’s products are covered by warranty to be free from defects in material and workmanship
for periods ranging from one year to five years. At the time of sale, the Company accrues a warranty liability for
estimated costs to provide products, parts or services to repair or replace products in satisfaction of the warranty
obligation. The Company’s estimate of costs to fulfill its warranty obligations is based on historical experience
and expectations of future conditions. When the Company experiences changes in warranty claim activity or costs
associated with fulfilling those claims, the warranty liability is adjusted accordingly. Changes in the Company’s
warranty liability for the years ended March 31, 2010 and 2011 were as follows (in thousands):
March 31,
2011 2010
Warranty liability, beginning of year ........................................ $3,002 $2,867
Provision for warranties issued during the year .......................... 18,666 16,344
Settlements made during the year ..................................... (16,698)(16,209)
Warranty liability, end of year ............................................. $ 4,970 $3,002