Logitech 2011 Annual Report Download - page 123
Download and view the complete annual report
Please find page 123 of the 2011 Logitech annual report below. You can navigate through the pages in the report by either clicking on the pages listed below, or by using the keyword search tool below to find specific information within the annual report.-
 1
1 -
2
-
3
-
4
-
5
-
6
-
7
-
8
-
9
-
10
-
11
-
12
-
13
-
14
-
15
-
16
-
17
-
18
-
19
-
20
-
21
-
22
-
23
-
24
-
25
-
26
-
27
-
28
-
29
-
30
-
31
-
32
-
33
-
34
-
35
-
36
-
37
-
38
-
39
-
40
-
41
-
42
-
43
-
44
-
45
-
46
-
47
-
48
-
49
-
50
-
51
-
52
-
53
-
54
-
55
-
56
-
57
-
58
-
59
-
60
-
61
-
62
-
63
-
64
-
65
-
66
-
67
-
68
-
69
-
70
-
71
-
72
-
73
-
74
-
75
-
76
-
77
-
78
-
79
-
80
-
81
-
82
-
83
-
84
-
85
-
86
-
87
-
88
-
89
-
90
-
91
-
92
-
93
-
94
-
95
-
96
-
97
-
98
-
99
-
100
-
101
-
102
-
103
-
104
-
105
-
106
-
107
-
108
-
109
-
110
-
111
-
112
-
 113
113 -
 114
114 -
 115
115 -
 116
116 -
 117
117 -
 118
118 -
 119
119 -
 120
120 -
 121
121 -
 122
122 -
 123
123 -
 124
124 -
 125
125 -
 126
126 -
 127
127 -
 128
128 -
 129
129 -
 130
130 -
 131
131 -
 132
132 -
 133
133 -
134
-
135
-
136
-
137
-
138
-
139
-
140
-
141
-
142
-
143
-
144
-
145
-
146
-
147
-
148
-
149
-
150
-
151
-
152
-
153
-
154
-
155
-
156
-
157
-
158
-
159
-
160
-
161
-
162
-
163
-
164
-
165
-
166
-
167
-
168
-
169
-
170
-
171
-
172
-
173
-
174
-
175
-
176
-
177
-
178
-
179
-
180
-
181
-
182
-
183
-
184
-
185
-
186
-
187
-
188
-
189
-
190
-
191
-
192
-
193
-
194
-
195
-
196
-
197
-
198
-
199
-
200
-
201
-
202
-
203
-
204
-
205
-
206
-
207
-
208
-
209
-
210
-
211
-
212
-
213
-
214
-
215
-
216
-
217
-
218
-
219
-
220
-
221
-
222
-
223
-
224
-
225
-
226
-
227
-
228
-
229
-
230
-
231
-
232
-
233
-
234
-
235
-
236
-
237
-
238
-
239
-
240
-
241
-
242
-
243
-
244
-
245
-
246
-
247
-
248
-
249
-
250
-
251
-
252
-
253
-
254
-
255
-
256
 |
 |

111
ENglISH
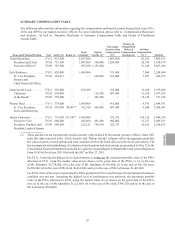
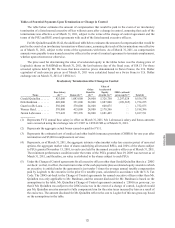
SUMMARY COMPENSATION TABLE
The following table provides information regarding the compensation and benefits earned during fiscal years 2011,
2010, and 2009 by our named executive officers. For more information, please refer to “Compensation Disclosure
and Analysis,” as well as “Narrative Disclosure to Summary Compensation Table and Grants of Plan-Based
Awards Table.”
Name and Principal Position Year Salary ($) Bonus ($) Stock
Awards($) (1) Option
Awards ($) (1)
Non-equity
Incentive Plan
Compensation
($)(2)
Changes in
Nonqualified
Deferred
Compensation
Earnings($)
All Other
Compensation
($) (3) Total ($)
Gerald Quindlen .......... FY11 825,000 — 5,835,050 — 1,083,000 — 62,365 7,805,415
President and Chief FY10 787,500 — 1,007,600 394,000 1,299,000 — 50,370 3,538,470
Executive Officer(6) FY09 787,500 — 697,500 1,151,000 — — 31,549 2,667,549
Erik Bardman ............ FY11 420,000 — 1,489,800 — 331,000 — 7,800 2,248,600
Sr. Vice President,
Finance and FY10 184,615 — — 620,000 162,000 — 3,257 969,872
Chief Financial Officer
Guerrino De Luca ......... FY11 550,000 — 835,500 — 578,000 — 12,168 1,975,668
Chairman FY10 550,000 — — 118,200 907,000 — 12,168 1,587,368
of the Board(7) FY09 550,000 — — 223,200 — — 18,128 791,328
Werner Heid . . . . . . . . . . . . . FY11 570,000 — 1,489,800 — 415,000 — 9,741 2,484,541
Sr. Vice President,
Sales and Marketing FY10 550,000 40,467(4) 362,520 450,450 607,000 — 9,648 2,020,085
Junien Labrousse . . . . . . . . . FY11 718,588 133,547(5) 1,489,800 — 535,276 — 169,128 3,046,339
Executive Vice- FY10 680,000 — 545,860 491,400 680,000 — 12,271 2,409,531
President, Products and FY09 680,000 — 523,125 754,950 222,333 — 10,415 2,190,823
President, Logitech Europe
(1) These amounts do not represent the actual economic value realized by the named executive officer. Under SEC
rules, the values reported in the “Stock Awards” and “Option Awards” columns reflect the aggregate grant date
fair value of grants of stock options and stock awards to each of the listed officers in the fiscal years shown. The
key assumptions and methodology of valuation of stock options and stock awards are presented in Note 12 to the
Consolidated Financial Statements included in Logitech’s Annual Report to Shareholders and Annual Report on
Form 10-K for fiscal year 2011 filed with the SEC on May 27, 2011.
For FY11: Assuming the highest level of performance is achieved, the maximum possible value of the PSUs
allocated in FY11, using the market value of our shares on the grant date of the PSUs, is: (a) in the case
of Mr. Quindlen, $5,724,600; (b) in the case of Mr. Bardman, $1,461,600; (c) in the case of Mr. De Luca,
$1,218,000; (d) in the case of Mr. Heid, $1,461,600; and (e) in the case of Mr. Labrousse, $1,461,600.
For FY10: None of the shares represented by PSUs granted in FY10 vested because the minimum performance
condition was not met. Assuming the highest level of performance was achieved, the maximum possible
value of the PSUs allocated in FY10, using the market value of our shares on the grant date of the PSUs,
was: (a) in the case of Mr. Quindlen; $1,121,600; (b) in the case of Mr. Heid, $364,520; and (c) in the case of
Mr. Labrousse, $560,800.