Logitech 2011 Annual Report Download - page 112
Download and view the complete annual report
Please find page 112 of the 2011 Logitech annual report below. You can navigate through the pages in the report by either clicking on the pages listed below, or by using the keyword search tool below to find specific information within the annual report.-
 1
1 -
2
-
3
-
4
-
5
-
6
-
7
-
8
-
9
-
10
-
11
-
12
-
13
-
14
-
15
-
16
-
17
-
18
-
19
-
20
-
21
-
22
-
23
-
24
-
25
-
26
-
27
-
28
-
29
-
30
-
31
-
32
-
33
-
34
-
35
-
36
-
37
-
38
-
39
-
40
-
41
-
42
-
43
-
44
-
45
-
46
-
47
-
48
-
49
-
50
-
51
-
52
-
53
-
54
-
55
-
56
-
57
-
58
-
59
-
60
-
61
-
62
-
63
-
64
-
65
-
66
-
67
-
68
-
69
-
70
-
71
-
72
-
73
-
74
-
75
-
76
-
77
-
78
-
79
-
80
-
81
-
82
-
83
-
84
-
85
-
86
-
87
-
88
-
89
-
90
-
91
-
92
-
93
-
94
-
95
-
96
-
97
-
98
-
99
-
100
-
101
-
 102
102 -
 103
103 -
 104
104 -
 105
105 -
 106
106 -
 107
107 -
 108
108 -
 109
109 -
 110
110 -
 111
111 -
 112
112 -
 113
113 -
 114
114 -
 115
115 -
 116
116 -
 117
117 -
 118
118 -
 119
119 -
 120
120 -
 121
121 -
 122
122 -
123
-
124
-
125
-
126
-
127
-
128
-
129
-
130
-
131
-
132
-
133
-
134
-
135
-
136
-
137
-
138
-
139
-
140
-
141
-
142
-
143
-
144
-
145
-
146
-
147
-
148
-
149
-
150
-
151
-
152
-
153
-
154
-
155
-
156
-
157
-
158
-
159
-
160
-
161
-
162
-
163
-
164
-
165
-
166
-
167
-
168
-
169
-
170
-
171
-
172
-
173
-
174
-
175
-
176
-
177
-
178
-
179
-
180
-
181
-
182
-
183
-
184
-
185
-
186
-
187
-
188
-
189
-
190
-
191
-
192
-
193
-
194
-
195
-
196
-
197
-
198
-
199
-
200
-
201
-
202
-
203
-
204
-
205
-
206
-
207
-
208
-
209
-
210
-
211
-
212
-
213
-
214
-
215
-
216
-
217
-
218
-
219
-
220
-
221
-
222
-
223
-
224
-
225
-
226
-
227
-
228
-
229
-
230
-
231
-
232
-
233
-
234
-
235
-
236
-
237
-
238
-
239
-
240
-
241
-
242
-
243
-
244
-
245
-
246
-
247
-
248
-
249
-
250
-
251
-
252
-
253
-
254
-
255
-
256
 |
 |

100
Grants to Mr. Quindlen. On November 15, 2010 during the annual stock focal cycle, Mr. Quindlen received a
PSU grant for 141,000 shares, assuming 100% target performance, and an RSU grant of 94,000 shares, as part of his
fiscal year 2011 annual compensation as CEO. In the analysis provided by the Committee’s independent compensation
consultant, it was noted that Mr. Quindlen’s fiscal year 2010 equity grants and his equity value as a percentage of market
capitalization were significantly below the 25th percentile for CEOs in our peer group. Their resulting recommendation
was to provide a fiscal year 2011 equity grant with value at least median for CEOs in our peer group to begin to
improve Mr. Quindlen’s position relative to the CEOs of our benchmark peer companies. The total number of shares
granted to Mr. Quindlen was based upon the mix of compensation components, the recommendation provided by
the independent consultant, the Compensation Committee’s consideration of the accrued value of past grants to
Mr. Quindlen, as well as the Compensation Committee’s estimate of Mr. Quindlen’s potential for future contributions
to Logitech’s success. Mr. Quindlen’s fiscal year 2011 equity grants were above the median value for our peer
group; however his total equity value as a percentage of market capitalization remained below market median for
our peer group.
Grant to Mr. De Luca. On November 15, 2010 during the annual stock focal cycle, Mr. De Luca received a
PSU grant for 30,000 shares, assuming 100% target performance, as part of his fiscal year 2011 compensation as
Chairman. Mr. De Luca did not receive any other equity incentive grants during fiscal year 2011.
Grants to Other Named Executive Officers. The equity incentive award grants made to all Logitech named
executive officers during fiscal year 2011 are set out in the Grants of Plan-Based Awards in Fiscal Year 2011 table
below. The value of long-term equity incentive awards in the form of PSUs and RSUs granted during fiscal year
2011 was in aggregate below the peer group, based on March 2010 compensation review data produced by the
Committee’s independent compensation consultant.
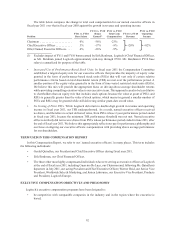
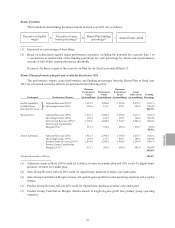
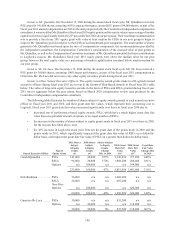
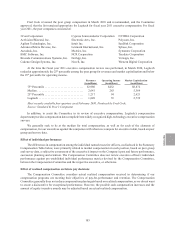
The following table illustrates the number of shares subject to equity awards granted to each named executive
officer in fiscal year 2011 and 2010, and their grant date fair values, which represent their accounting cost to
Logitech. Fiscal year 2011 grant date fair values increased significantly over those in fiscal year 2010 due to:
• increased use of performance-based equity awards, PSUs, which have a much higher grant date fair
value than an equivalent amount of options or an equal number of RSUs,
• the increase in the number of shares subject to equity grants made in fiscal year 2011 over those in 2010,
for the reasons described above, and
• the 45% increase in Logitech’s stock price between the grant date of the grants made in 2010 and the
grants made in 2011, which significantly impacted the grant date fair value of RSUs on a dollar-for-
dollar basis, and impacts the grant date fair value of PSUs on a greater than dollar-for-dollar basis.
Named Executive Officer Type of
Equity Grant
2011 Shares
Subject
to Equity
Grants
(#)
2010 Shares
Subject
to Equity
Grants
(#)
Shares Subject
to Equity
Grants -
Change
2011 to 2010
2011 Grant
Date Fair
Value
($)(1)
2010 Grant
Date Fair
Value
($)(1)
Grant Date
Fair Value
Change 2011
to 2010
Gerald Quindlen ....... PSUs 141,000 40,000 253% 3,926,850 727,200 440%
RSUs 94,000 20,000 370% 1,908,200 280,400 581%
Options n/a 100,000 n/a n/a 394,000 n/a
235,000 160,000 47% 5,835,050 1,401,600 316%
Erik Bardman ......... PSUs 36,000 n/a n/a 1,002,600 n/a n/a
RSUs 24,000 n/a n/a 487,200 n/a n/a
New Hire
Options n/a 100,000 n/a n/a 620,000 n/a
60,000 100,000 -40% 1,489,800 620,000 140%
Guerrino De Luca ...... PSUs 30,000 n/a n/a 835,500 n/a n/a
Options n/a 30,000 n/a n/a 118,200 n/a
30,000 30,000 0% 835,500 118,200 607%