Logitech 2011 Annual Report Download - page 207
Download and view the complete annual report
Please find page 207 of the 2011 Logitech annual report below. You can navigate through the pages in the report by either clicking on the pages listed below, or by using the keyword search tool below to find specific information within the annual report.-
 1
1 -
2
-
3
-
4
-
5
-
6
-
7
-
8
-
9
-
10
-
11
-
12
-
13
-
14
-
15
-
16
-
17
-
18
-
19
-
20
-
21
-
22
-
23
-
24
-
25
-
26
-
27
-
28
-
29
-
30
-
31
-
32
-
33
-
34
-
35
-
36
-
37
-
38
-
39
-
40
-
41
-
42
-
43
-
44
-
45
-
46
-
47
-
48
-
49
-
50
-
51
-
52
-
53
-
54
-
55
-
56
-
57
-
58
-
59
-
60
-
61
-
62
-
63
-
64
-
65
-
66
-
67
-
68
-
69
-
70
-
71
-
72
-
73
-
74
-
75
-
76
-
77
-
78
-
79
-
80
-
81
-
82
-
83
-
84
-
85
-
86
-
87
-
88
-
89
-
90
-
91
-
92
-
93
-
94
-
95
-
96
-
97
-
98
-
99
-
100
-
101
-
102
-
103
-
104
-
105
-
106
-
107
-
108
-
109
-
110
-
111
-
112
-
113
-
114
-
115
-
116
-
117
-
118
-
119
-
120
-
121
-
122
-
123
-
124
-
125
-
126
-
127
-
128
-
129
-
130
-
131
-
132
-
133
-
134
-
135
-
136
-
137
-
138
-
139
-
140
-
141
-
142
-
143
-
144
-
145
-
146
-
147
-
148
-
149
-
150
-
151
-
152
-
153
-
154
-
155
-
156
-
157
-
158
-
159
-
160
-
161
-
162
-
163
-
164
-
165
-
166
-
167
-
168
-
169
-
170
-
171
-
172
-
173
-
174
-
175
-
176
-
177
-
178
-
179
-
180
-
181
-
182
-
183
-
184
-
185
-
186
-
187
-
188
-
189
-
190
-
191
-
192
-
193
-
194
-
195
-
196
-
 197
197 -
 198
198 -
 199
199 -
 200
200 -
 201
201 -
 202
202 -
 203
203 -
 204
204 -
 205
205 -
 206
206 -
 207
207 -
 208
208 -
 209
209 -
 210
210 -
 211
211 -
 212
212 -
 213
213 -
 214
214 -
 215
215 -
 216
216 -
 217
217 -
218
-
219
-
220
-
221
-
222
-
223
-
224
-
225
-
226
-
227
-
228
-
229
-
230
-
231
-
232
-
233
-
234
-
235
-
236
-
237
-
238
-
239
-
240
-
241
-
242
-
243
-
244
-
245
-
246
-
247
-
248
-
249
-
250
-
251
-
252
-
253
-
254
-
255
-
256
 |
 |

ANNUAl REPORT
195
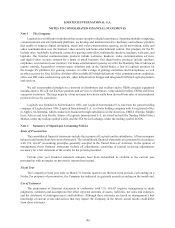
Derivative Financial Instruments
The Company enters into foreign exchange forward contracts to reduce the short-term effects of foreign
currency fluctuations on certain foreign currency receivables or payables and to hedge against exposure to changes
in foreign currency exchange rates related to its subsidiaries’ forecasted inventory purchases. These forward
contracts generally mature within one to three months. The Company may also enter into foreign exchange swap
contracts to extend the terms of its foreign exchange forward contracts.
Gains and losses in the fair value of the effective portion of our forward contracts related to forecasted
inventory purchases are deferred as a component of accumulated other comprehensive loss until the hedged
inventory purchases are sold, at which time the gains or losses are reclassified to cost of goods sold. Gains or
losses in fair value on forward contracts which offset translation losses or gains on foreign currency receivables or
payables are recognized in earnings monthly and are included in other income (expense), net.
Recent Accounting Pronouncements
In December 2010, the FASB (Financial Accounting Standards Board) issued ASU 2010-28, Intangibles —
Goodwill and Other (Topic 350): When to Perform Step 2 of the Goodwill Impairment Test for Reporting Units with
Zero or Negative Carrying Amounts. For reporting units with zero or negative carrying amounts, if it is more likely
than not that a goodwill impairment exists, ASU 2010-28 requires performance of an additional test to determine
whether goodwill has been impaired and to calculate the amount of impairment. In determining whether it is
more likely than not that a goodwill impairment exists, an entity should consider whether there are any adverse
qualitative factors indicating that an impairment may exist. ASU 2010-28 is effective for fiscal years and interim
periods within those years beginning after December 15, 2010. Logitech will adopt ASU 2009-28 in the first
quarter of fiscal year 2012. The impact of adopting ASU 2010-28 will not be known until the Company performs
its evaluations of goodwill impairment.
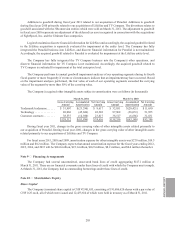
In December 2010, the FASB issued ASU 2010-29, Business Combinations (Topic 805): Disclosure of
Supplementary Pro Forma Information for Business Combinations. ASU 2010-29 specifies that, for material business
combinations when comparative financial statements are presented, revenue and earnings of the combined entity
should be disclosed as though the business combination had occurred as of the beginning of the comparable prior
annual reporting period. ASU 2010-09 also expands the supplemental pro forma disclosures to include a description
of the nature and amount of material, nonrecurring pro forma adjustments directly attributable to the business
combination included in the reported pro forma revenue and earnings. ASU 2010-09 is effective prospectively for
business combinations with an acquisition date on or after the beginning of the first annual reporting period after
December 15, 2010. We will adopt this guidance for acquisitions beginning in fiscal year 2012.
Note 3 — Net Income per Share
The computations of basic and diluted net income per share for the Company were as follows (in thousands
except per share amounts):
Year ended March 31,
2011 2010 2009
Net income — basic and diluted. . . . . . . . . . . . . . . . . . . . . . . . . . . . . . . . . . . $128,460 $64,957 $107,032
Weighted average shares — basic . . . . . . . . . . . . . . . . . . . . . . . . . . . . . . . . . 176,928 177,279 178,811
Effect of dilutive stock options .................................... 1,862 2,061 4,100
Weighted average shares — diluted ................................ 178,790 179,340 182,911
Net income per share — basic .................................... $0.73 $0.37 $0.60
Net income per share — diluted ................................... $0.72 $0.36 $0.59