Logitech 2011 Annual Report Download - page 152
Download and view the complete annual report
Please find page 152 of the 2011 Logitech annual report below. You can navigate through the pages in the report by either clicking on the pages listed below, or by using the keyword search tool below to find specific information within the annual report.-
 1
1 -
2
-
3
-
4
-
5
-
6
-
7
-
8
-
9
-
10
-
11
-
12
-
13
-
14
-
15
-
16
-
17
-
18
-
19
-
20
-
21
-
22
-
23
-
24
-
25
-
26
-
27
-
28
-
29
-
30
-
31
-
32
-
33
-
34
-
35
-
36
-
37
-
38
-
39
-
40
-
41
-
42
-
43
-
44
-
45
-
46
-
47
-
48
-
49
-
50
-
51
-
52
-
53
-
54
-
55
-
56
-
57
-
58
-
59
-
60
-
61
-
62
-
63
-
64
-
65
-
66
-
67
-
68
-
69
-
70
-
71
-
72
-
73
-
74
-
75
-
76
-
77
-
78
-
79
-
80
-
81
-
82
-
83
-
84
-
85
-
86
-
87
-
88
-
89
-
90
-
91
-
92
-
93
-
94
-
95
-
96
-
97
-
98
-
99
-
100
-
101
-
102
-
103
-
104
-
105
-
106
-
107
-
108
-
109
-
110
-
111
-
112
-
113
-
114
-
115
-
116
-
117
-
118
-
119
-
120
-
121
-
122
-
123
-
124
-
125
-
126
-
127
-
128
-
129
-
130
-
131
-
132
-
133
-
134
-
135
-
136
-
137
-
138
-
139
-
140
-
141
-
 142
142 -
 143
143 -
 144
144 -
 145
145 -
 146
146 -
 147
147 -
 148
148 -
 149
149 -
 150
150 -
 151
151 -
 152
152 -
 153
153 -
 154
154 -
 155
155 -
 156
156 -
 157
157 -
 158
158 -
 159
159 -
 160
160 -
 161
161 -
 162
162 -
163
-
164
-
165
-
166
-
167
-
168
-
169
-
170
-
171
-
172
-
173
-
174
-
175
-
176
-
177
-
178
-
179
-
180
-
181
-
182
-
183
-
184
-
185
-
186
-
187
-
188
-
189
-
190
-
191
-
192
-
193
-
194
-
195
-
196
-
197
-
198
-
199
-
200
-
201
-
202
-
203
-
204
-
205
-
206
-
207
-
208
-
209
-
210
-
211
-
212
-
213
-
214
-
215
-
216
-
217
-
218
-
219
-
220
-
221
-
222
-
223
-
224
-
225
-
226
-
227
-
228
-
229
-
230
-
231
-
232
-
233
-
234
-
235
-
236
-
237
-
238
-
239
-
240
-
241
-
242
-
243
-
244
-
245
-
246
-
247
-
248
-
249
-
250
-
251
-
252
-
253
-
254
-
255
-
256
 |
 |

140
management programs specific to the EMEA region that were intended to increase our visibility into channel and
consumer trends and to increase satisfaction among our channel partners. However the implementation of these
programs created unintended consequences, including higher-than-planned promotional spending on the sales that
occurred, frustrated customers, and reduced order flow due to the perceived increase in complexity.
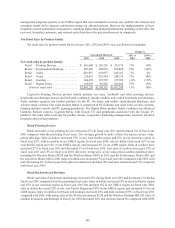
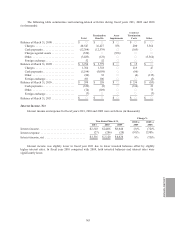
Net Retail Sales by Product Family
Net retail sales by product family for fiscal years 2011, 2010 and 2009 were as follows (in thousands):
Change %
Year Ended March 31, 2011 vs
2010 2010 vs
2009 2011 2010 2009
Net retail sales by product family:
Retail — Pointing Devices .............. $618,404 $528,236 $579,775 17%(9)%
Retail — Keyboards & Desktops ......... 390,426 329,038 384,809 19%(14)%
Retail — Audio ....................... 466,927 454,957 445,362 3% 2%
Retail — Video ....................... 255,015 228,344 248,339 12%(8)%
Retail — Gaming...................... 104,459 107,595 127,052 (3)% (15)%
Retail — Digital Home ................. 169,979 96,982 102,006 75%(5)%
Total net retail sales ................. $2,005,210 $1,745,152 $1,887,343 15%(8)%
Logitech’s Pointing Devices product family includes our mice, trackballs and other pointing devices.
Keyboards and desktops (mouse and keyboard combined) include cordless and corded keyboards and desktops.
Audio includes speakers and headset products for the PC, the home, and mobile entertainment platforms, and
wireless music systems. Our video product family is comprised of PC webcams and Alert video security systems.
Gaming includes console and PC gaming peripherals. The Digital Home product family combines our advanced
Harmony Remote controls, Logitech Revue with Google TV, and peripherals associated with the Google TV
platform. Net sales reflect accruals for product returns, cooperative marketing arrangements, customer incentive
programs and pricing programs.
Retail Pointing Devices
Retail unit sales of our pointing devices increased 27% in fiscal year 2011 and decreased 2% in fiscal year
2010 compared with the preceding fiscal years. The stronger growth in units reflects the success of our value-
priced offerings. Sales in dollars increased 57% in our Asia Pacific region and 21% in our Americas region in
fiscal year 2011, with no growth in our EMEA region. In fiscal year 2010, sales in dollars decreased 20% in our
Asia Pacific region and 14% in our EMEA region, and increased 4% in our AMR region. Sales of cordless mice
increased 27% in fiscal year 2011 and decreased 3% in fiscal year 2010. Unit sales of cordless mice grew 52% in
fiscal year 2011 and 15% in fiscal year 2010, driven by strong sales of our value-priced cordless notebook mice,
including the Wireless Mouse M215 and the Wireless Mouse M310 in 2011, and the Performance Mouse MX and
the Anywhere Mouse MX in 2010. Sales of corded mice decreased 7% in fiscal year 2011 compared with 2010, with
units increasing 6%. In fiscal year 2010, sales of corded mice declined 19% and units sold decreased 11% compared
with fiscal year 2009.
Retail Keyboards and Desktops
Retail unit sales of keyboards and desktops increased 23% during fiscal year 2011 and decreased 11% during
fiscal year 2010, compared with the preceding fiscal years. Sales in dollars increased 52% in our Asia Pacific region
and 35% in our Americas region in fiscal year 2011, but declined 6% in our EMEA region. In fiscal year 2010,
sales in dollars decreased 22% in our Asia Pacific Region and 20% in our EMEA region, and increased 1% in our
AMR region. Sales of cordless keyboards and desktops increased 28% and units increased 39% in fiscal year 2011
compared with 2010, with strong sales of the Wireless Keyboard K250 and the Wireless Desktop MK320. Sales of
cordless keyboards and desktops in fiscal year 2010 decreased 20% and units decreased 5% compared with 2009,