Logitech 2011 Annual Report Download - page 127
Download and view the complete annual report
Please find page 127 of the 2011 Logitech annual report below. You can navigate through the pages in the report by either clicking on the pages listed below, or by using the keyword search tool below to find specific information within the annual report.-
 1
1 -
2
-
3
-
4
-
5
-
6
-
7
-
8
-
9
-
10
-
11
-
12
-
13
-
14
-
15
-
16
-
17
-
18
-
19
-
20
-
21
-
22
-
23
-
24
-
25
-
26
-
27
-
28
-
29
-
30
-
31
-
32
-
33
-
34
-
35
-
36
-
37
-
38
-
39
-
40
-
41
-
42
-
43
-
44
-
45
-
46
-
47
-
48
-
49
-
50
-
51
-
52
-
53
-
54
-
55
-
56
-
57
-
58
-
59
-
60
-
61
-
62
-
63
-
64
-
65
-
66
-
67
-
68
-
69
-
70
-
71
-
72
-
73
-
74
-
75
-
76
-
77
-
78
-
79
-
80
-
81
-
82
-
83
-
84
-
85
-
86
-
87
-
88
-
89
-
90
-
91
-
92
-
93
-
94
-
95
-
96
-
97
-
98
-
99
-
100
-
101
-
102
-
103
-
104
-
105
-
106
-
107
-
108
-
109
-
110
-
111
-
112
-
113
-
114
-
115
-
116
-
 117
117 -
 118
118 -
 119
119 -
 120
120 -
 121
121 -
 122
122 -
 123
123 -
 124
124 -
 125
125 -
 126
126 -
 127
127 -
 128
128 -
 129
129 -
 130
130 -
 131
131 -
 132
132 -
 133
133 -
 134
134 -
 135
135 -
 136
136 -
 137
137 -
138
-
139
-
140
-
141
-
142
-
143
-
144
-
145
-
146
-
147
-
148
-
149
-
150
-
151
-
152
-
153
-
154
-
155
-
156
-
157
-
158
-
159
-
160
-
161
-
162
-
163
-
164
-
165
-
166
-
167
-
168
-
169
-
170
-
171
-
172
-
173
-
174
-
175
-
176
-
177
-
178
-
179
-
180
-
181
-
182
-
183
-
184
-
185
-
186
-
187
-
188
-
189
-
190
-
191
-
192
-
193
-
194
-
195
-
196
-
197
-
198
-
199
-
200
-
201
-
202
-
203
-
204
-
205
-
206
-
207
-
208
-
209
-
210
-
211
-
212
-
213
-
214
-
215
-
216
-
217
-
218
-
219
-
220
-
221
-
222
-
223
-
224
-
225
-
226
-
227
-
228
-
229
-
230
-
231
-
232
-
233
-
234
-
235
-
236
-
237
-
238
-
239
-
240
-
241
-
242
-
243
-
244
-
245
-
246
-
247
-
248
-
249
-
250
-
251
-
252
-
253
-
254
-
255
-
256
 |
 |

115
ENglISH
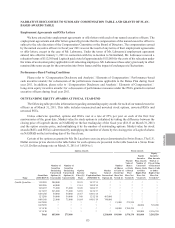
NARRATIVE DISCLOSURE TO SUMMARY COMPENSATION TABLE AND GRANTS OF PLAN-
BASED AWARDS TABLE
Employment Agreements and Offer Letters
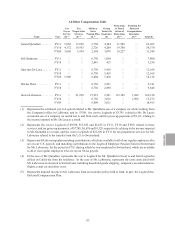
We have entered into employment agreements or offer letters with each of our named executive officers. The
employment agreements and offer letters generally provide that the compensation of the named executive officer is
subject to the sole discretion of the Compensation Committee or the Board of Directors. The compensation earned
by the named executive officers in fiscal year 2011 was not the result of any terms of their employment agreements
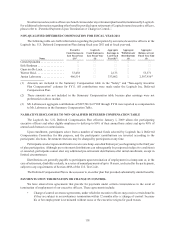
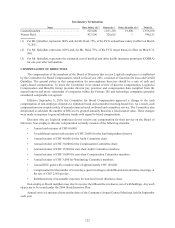
or offer letters, except in the case of Mr. Labrousse. Under the terms of Mr. Labrousse’s employment agreement
entered into effective January 1, 2011 in connection with his re-location to Switzerland, Mr. Labrousse received a
relocation bonus of $112,500 and Logitech paid a total of approximately $115,000 for the costs of his relocation under
the terms of a relocation policy applicable to all relocating employees. Mr. Labrousse’s base salary previously in effect
remained the same except for the conversion into Swiss francs and the impact of exchange rate fluctuations.
Performance-Based Vesting Conditions
Please refer to “Compensation Disclosure and Analysis—Elements of Compensation—Performance-based
cash incentive awards” for a discussion of the performance measures applicable to the Bonus Plan during fiscal
year 2011. In addition, please refer to “Compensation Disclosure and Analysis—Elements of Compensation—
Long-term equity incentive awards” for a discussion of performance measures under the PSUs granted to named
executive officers during fiscal year 2011.
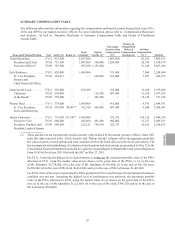
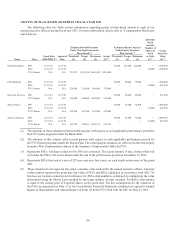
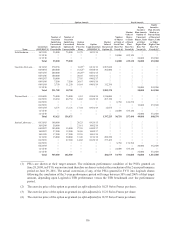
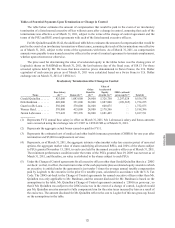
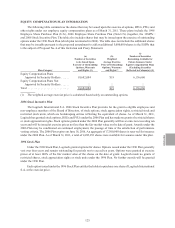
OUTSTANDING EQUITY AWARDS AT FISCAL YEAR-END
The following table provides information regarding outstanding equity awards for each of our named executive
officers as of March 31, 2011. This table includes unexercised and unvested stock options, unvested RSUs and
unvested PSUs.
Unless otherwise specified, options and RSUs vest at a rate of 25% per year on each of the first four
anniversaries of the grant date. Market value for stock options is calculated by taking the difference between the
closing price of Logitech shares on NASDAQ on the last trading day of the fiscal year ($18.13 on March 31, 2011)
and the option exercise price, and multiplying it by the number of outstanding options. Market value for stock
awards (RSUs and PSUs) is determined by multiplying the number of shares by the closing price of Logitech shares
on NASDAQ on the last trading day of the fiscal year.
Certain of the options as granted to Mr. De Luca have exercise prices denominated in Swiss Francs. The U.S.
Dollar exercise prices shown in the table below for such options are presented in the table based on a Swiss Franc
to U.S. Dollar exchange rate on March 31, 2011 of 1.0924 to 1.
Option Awards Stock Awards
Name Grant Date
(MM/DD/YY)
Number of
Securities
Underlying
Unexercised
Options (#)
Exercisable
Number of
Securities
Underlying
Unexercised
Options (#)
Unexercisable
Option
Exercise
Price ($) /
Share
Option
Expiration Date
(MM/DD/YY)
Market
Value of
Unexercised
Options ($)
Number
of Shares
or Units of
Stock That
Have Not
Vested (#)
Market
Value of
Shares
or Units
of Stock
That
Have Not
Vested ($)
Equity
Incentive
Plan Awards:
Number of
Unearned
Shares, Units
or Other
Rights That
Have Not
Vested (#)
Equity
Incentive
Plan Awards:
Market or
Payout Value
of Unearned
Shares, Units
or Other
Rights That
Have Not
Vested ($)(1)
Gerald Quindlen .... 11/02/05 200,000 — 20.25 10/17/15 — — — — —
10/02/06 60,000 — 21.61 10/02/16 — — — — —
10/02/07 75,000 25,000 30.09 10/02/17 — — — — —
10/19/07 225,000 75,000 34.39 10/19/17 — — — — —
04/01/08 50,000 50,000 26.67 04/01/18 — — — — —
12/12/08 50,000 50,000 13.48 12/12/18 465,000 — — — —
04/01/09 25,000 75,000 10.64 04/01/19 749,000 — — — —
06/29/09 — — — — — 15,000 271,950 — —
06/29/09 — — — — — — — 40,000 725,200
11/15/10 — — — — — 94,000 1,704,220 — —
11/15/10 — — — — — — — 141,000 2,556,330
Total 685,000 275,000 1,214,000 109,000 1,976,170 181,000 3,281,530