Logitech 2011 Annual Report Download - page 104
Download and view the complete annual report
Please find page 104 of the 2011 Logitech annual report below. You can navigate through the pages in the report by either clicking on the pages listed below, or by using the keyword search tool below to find specific information within the annual report.-
 1
1 -
2
-
3
-
4
-
5
-
6
-
7
-
8
-
9
-
10
-
11
-
12
-
13
-
14
-
15
-
16
-
17
-
18
-
19
-
20
-
21
-
22
-
23
-
24
-
25
-
26
-
27
-
28
-
29
-
30
-
31
-
32
-
33
-
34
-
35
-
36
-
37
-
38
-
39
-
40
-
41
-
42
-
43
-
44
-
45
-
46
-
47
-
48
-
49
-
50
-
51
-
52
-
53
-
54
-
55
-
56
-
57
-
58
-
59
-
60
-
61
-
62
-
63
-
64
-
65
-
66
-
67
-
68
-
69
-
70
-
71
-
72
-
73
-
74
-
75
-
76
-
77
-
78
-
79
-
80
-
81
-
82
-
83
-
84
-
85
-
86
-
87
-
88
-
89
-
90
-
91
-
92
-
93
-
 94
94 -
 95
95 -
 96
96 -
 97
97 -
 98
98 -
 99
99 -
 100
100 -
 101
101 -
 102
102 -
 103
103 -
 104
104 -
 105
105 -
 106
106 -
 107
107 -
 108
108 -
 109
109 -
 110
110 -
 111
111 -
 112
112 -
 113
113 -
 114
114 -
115
-
116
-
117
-
118
-
119
-
120
-
121
-
122
-
123
-
124
-
125
-
126
-
127
-
128
-
129
-
130
-
131
-
132
-
133
-
134
-
135
-
136
-
137
-
138
-
139
-
140
-
141
-
142
-
143
-
144
-
145
-
146
-
147
-
148
-
149
-
150
-
151
-
152
-
153
-
154
-
155
-
156
-
157
-
158
-
159
-
160
-
161
-
162
-
163
-
164
-
165
-
166
-
167
-
168
-
169
-
170
-
171
-
172
-
173
-
174
-
175
-
176
-
177
-
178
-
179
-
180
-
181
-
182
-
183
-
184
-
185
-
186
-
187
-
188
-
189
-
190
-
191
-
192
-
193
-
194
-
195
-
196
-
197
-
198
-
199
-
200
-
201
-
202
-
203
-
204
-
205
-
206
-
207
-
208
-
209
-
210
-
211
-
212
-
213
-
214
-
215
-
216
-
217
-
218
-
219
-
220
-
221
-
222
-
223
-
224
-
225
-
226
-
227
-
228
-
229
-
230
-
231
-
232
-
233
-
234
-
235
-
236
-
237
-
238
-
239
-
240
-
241
-
242
-
243
-
244
-
245
-
246
-
247
-
248
-
249
-
250
-
251
-
252
-
253
-
254
-
255
-
256
 |
 |

92
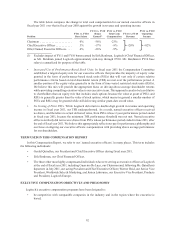
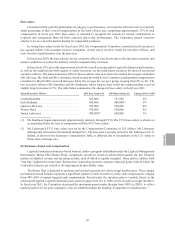
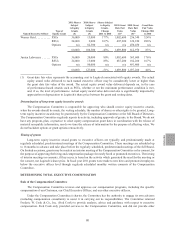
The table below compares the change in total cash compensation for our named executive officers in
fiscal year 2011 over that in fiscal year 2010 against the growth in revenue and operating income.
Position FY11 vs. FY10
Base Salary
FY11 vs. FY10
Bonus
Earned(1)
FY11 vs. FY10
Total Cash
Compensation FY11 vs. FY10
Revenue
FY11 vs. FY10
Operating
Income
Chairman ...................... 0% -36% -23% +20% +82%Chief Executive Officer . . . . . . . . . . . 5% -17% -9%
Other Named Executive Officers .... 4% -26% -9%
(1) Excludes impact of FY11 and FY10 bonus earned by Erik Bardman, Logitech’s Chief Financial Officer,
as Mr. Bardman joined Logitech approximately mid-way through FY10. Mr. Bardman’s FY10 base
salary is annualized for purpose of the table.
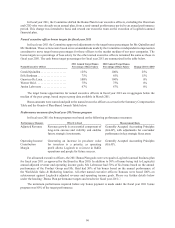
• Increased Use of Performance-Based Stock Units. In fiscal year 2011 the Compensation Committee
established a targeted equity mix for our executive officers that provides the majority of equity value
granted in the form of performance-based stock units (PSUs) that will vest only if certain relative
performance criteria based on total shareholder return (TSR) are met over the performance period. A
smaller portion of the equity value granted is in the form of time-vested restricted stock units (RSUs).
We believe this mix will provide the appropriate focus on driving above-average shareholder returns
while providing compelling retention value to our executive team. This approach can also be less dilutive
to shareholders than an equity mix that includes stock options because the value at grant of PSUs and
RSUs is generally greater than the value of stock options, which means in general a smaller number of
PSUs and RSUs may be granted while still delivering similar grant-date award value.
• No Vesting of Prior PSUs. While Logitech did return to double-digit growth in revenue and operating
income in fiscal year 2011, our TSR underperformed. As a result, named executive officers received
no shares, and therefore no actual delivered value, from PSUs whose 2-year performance period ended
in fiscal year 2011, because the minimum TSR performance threshold was not met. Named executive
officers similarly did not receive shares from PSUs whose performance period ended in June 2011, after
the end of fiscal year 2011. We believe this appropriately reflects our pay for performance philosophy and
our focus on aligning our executive officers’ compensation with providing above average performance
for our shareholders.
TERM USED IN THIS COMPENSATION REPORT
In this Compensation Report, we refer to our “named executive officers” in many places. This term includes
the following individuals:
• Gerald Quindlen, our President and Chief Executive Officer during fiscal year 2011.
• Erik Bardman, our Chief Financial Officer.
• The three other most highly compensated individuals who were serving as executive officers of Logitech
at the end of fiscal year 2011, including Guerrino De Luca, our Chairman and, following Mr. Quindlen’s
departure in July 2011, our acting President and Chief Executive Officer; Werner Heid, our Senior Vice
President, Worldwide Sales & Marketing, and Junien Labrousse, our Executive Vice President, Products
and President, Logitech Europe.
EXECUTIVE COMPENSATION OBJECTIVES AND PHILOSOPHY
Logitech’s executive compensation programs have been designed to:
• be competitive with comparable companies in the industry and in the region where the executive is
based;