Logitech 2011 Annual Report Download - page 223
Download and view the complete annual report
Please find page 223 of the 2011 Logitech annual report below. You can navigate through the pages in the report by either clicking on the pages listed below, or by using the keyword search tool below to find specific information within the annual report.-
 1
1 -
2
-
3
-
4
-
5
-
6
-
7
-
8
-
9
-
10
-
11
-
12
-
13
-
14
-
15
-
16
-
17
-
18
-
19
-
20
-
21
-
22
-
23
-
24
-
25
-
26
-
27
-
28
-
29
-
30
-
31
-
32
-
33
-
34
-
35
-
36
-
37
-
38
-
39
-
40
-
41
-
42
-
43
-
44
-
45
-
46
-
47
-
48
-
49
-
50
-
51
-
52
-
53
-
54
-
55
-
56
-
57
-
58
-
59
-
60
-
61
-
62
-
63
-
64
-
65
-
66
-
67
-
68
-
69
-
70
-
71
-
72
-
73
-
74
-
75
-
76
-
77
-
78
-
79
-
80
-
81
-
82
-
83
-
84
-
85
-
86
-
87
-
88
-
89
-
90
-
91
-
92
-
93
-
94
-
95
-
96
-
97
-
98
-
99
-
100
-
101
-
102
-
103
-
104
-
105
-
106
-
107
-
108
-
109
-
110
-
111
-
112
-
113
-
114
-
115
-
116
-
117
-
118
-
119
-
120
-
121
-
122
-
123
-
124
-
125
-
126
-
127
-
128
-
129
-
130
-
131
-
132
-
133
-
134
-
135
-
136
-
137
-
138
-
139
-
140
-
141
-
142
-
143
-
144
-
145
-
146
-
147
-
148
-
149
-
150
-
151
-
152
-
153
-
154
-
155
-
156
-
157
-
158
-
159
-
160
-
161
-
162
-
163
-
164
-
165
-
166
-
167
-
168
-
169
-
170
-
171
-
172
-
173
-
174
-
175
-
176
-
177
-
178
-
179
-
180
-
181
-
182
-
183
-
184
-
185
-
186
-
187
-
188
-
189
-
190
-
191
-
192
-
193
-
194
-
195
-
196
-
197
-
198
-
199
-
200
-
201
-
202
-
203
-
204
-
205
-
206
-
207
-
208
-
209
-
210
-
211
-
212
-
 213
213 -
 214
214 -
 215
215 -
 216
216 -
 217
217 -
 218
218 -
 219
219 -
 220
220 -
 221
221 -
 222
222 -
 223
223 -
 224
224 -
 225
225 -
 226
226 -
 227
227 -
 228
228 -
 229
229 -
 230
230 -
 231
231 -
 232
232 -
 233
233 -
234
-
235
-
236
-
237
-
238
-
239
-
240
-
241
-
242
-
243
-
244
-
245
-
246
-
247
-
248
-
249
-
250
-
251
-
252
-
253
-
254
-
255
-
256
 |
 |

ANNUAl REPORT
211
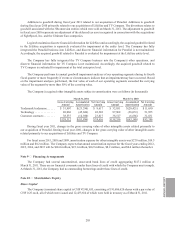
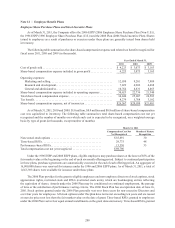
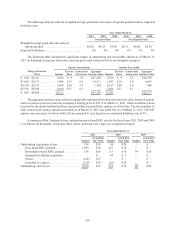
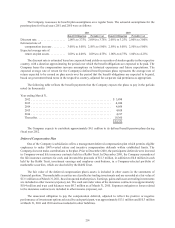
The Company estimates the fair value of the time-based RSUs based on the share market price on the date
of grant. The fair value of the performance-based RSUs is estimated using the Monte-Carlo simulation model
applying the following assumptions:
FY 2011
Grants FY 2010
Grants FY 2009
Grants
Dividend yield ..................................................... 0% 0% 0%
Expected life ...................................................... 3 years 2 years 2 years
Expected volatility ................................................. 51%58%41%
Risk-free interest rate ............................................... 0.81%1.11%1.82%
The dividend yield assumption is based on the Company’s history and future expectations of dividend payouts.
The expected life of the performance-based RSUs is the service period at the end of which the RSUs will vest if the
performance conditions are satisfied. The volatility assumption is based on the actual volatility of Logitech’s daily
closing share price over a look-back period equal to the years of expected life. The risk free interest rate is derived
from the yield on US Treasury Bonds for a term of the same number of years as the expected life.
As of March 31, 2011, the grant date fair values of outstanding RSUs ranged from $14 to $28 per RSU, and the
weighted average contractual life was 3.8 years.
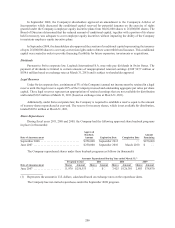
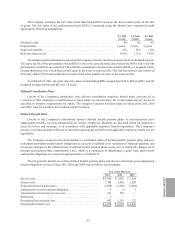
Defined Contribution Plans
Certain of the Company’s subsidiaries have defined contribution employee benefit plans covering all or
a portion of their employees. Contributions to these plans are discretionary for certain plans and are based on
specified or statutory requirements for others. The charges to expense for these plans for fiscal years 2011, 2010
and 2009, were $8.9 million, $8.2 million and $8.3 million.
Defined Benefit Plans
Certain of the Company’s subsidiaries sponsor defined benefit pension plans or non-retirement post-
employment benefits covering substantially all of their employees. Benefits are provided based on employees’
years of service and earnings, or in accordance with applicable employee benefit regulations. The Company’s
practice is to fund amounts sufficient to meet the requirements set forth in the applicable employee benefit and tax
regulations.
The Company recognizes the underfunded or overfunded status of defined benefit pension plans and non-
retirement post-employment benefit obligations as an asset or liability in its statement of financial position, and
recognizes changes in the funded status of defined benefit pension plans in the year in which the changes occur
through accumulated other comprehensive loss, which is a component of shareholders’ equity. Each plan’s assets
and benefit obligations are measured approximately as of March 31.
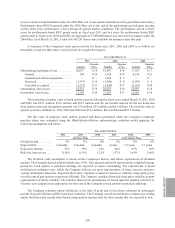
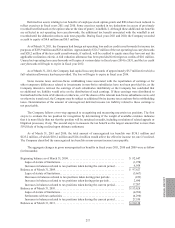
The net periodic benefit cost of the defined benefit pension plans and the non-retirement post-employment
benefit obligations for fiscal years 2011, 2010 and 2009 was as follows (in thousands):
Year ended March 31,
2011 2010 2009
Service cost ............................................. $4,396 $3,983 $2,814
Interest cost ............................................. 1,745 1,430 1,520
Expected return on plan assets .............................. (1,818)(1,200)(1,488)
Amortization of net transition obligation ...................... 445
Amortization of net prior service cost . . . . . . . . . . . . . . . . . . . . . . . . 161 138 —
Settlement .............................................. 2 — —
Recognized net actuarial loss ............................... 482 1,239 232
Net periodic benefit cost ................................... $4,972 $5,594 $3,083