Logitech 2011 Annual Report Download - page 224
Download and view the complete annual report
Please find page 224 of the 2011 Logitech annual report below. You can navigate through the pages in the report by either clicking on the pages listed below, or by using the keyword search tool below to find specific information within the annual report.-
 1
1 -
2
-
3
-
4
-
5
-
6
-
7
-
8
-
9
-
10
-
11
-
12
-
13
-
14
-
15
-
16
-
17
-
18
-
19
-
20
-
21
-
22
-
23
-
24
-
25
-
26
-
27
-
28
-
29
-
30
-
31
-
32
-
33
-
34
-
35
-
36
-
37
-
38
-
39
-
40
-
41
-
42
-
43
-
44
-
45
-
46
-
47
-
48
-
49
-
50
-
51
-
52
-
53
-
54
-
55
-
56
-
57
-
58
-
59
-
60
-
61
-
62
-
63
-
64
-
65
-
66
-
67
-
68
-
69
-
70
-
71
-
72
-
73
-
74
-
75
-
76
-
77
-
78
-
79
-
80
-
81
-
82
-
83
-
84
-
85
-
86
-
87
-
88
-
89
-
90
-
91
-
92
-
93
-
94
-
95
-
96
-
97
-
98
-
99
-
100
-
101
-
102
-
103
-
104
-
105
-
106
-
107
-
108
-
109
-
110
-
111
-
112
-
113
-
114
-
115
-
116
-
117
-
118
-
119
-
120
-
121
-
122
-
123
-
124
-
125
-
126
-
127
-
128
-
129
-
130
-
131
-
132
-
133
-
134
-
135
-
136
-
137
-
138
-
139
-
140
-
141
-
142
-
143
-
144
-
145
-
146
-
147
-
148
-
149
-
150
-
151
-
152
-
153
-
154
-
155
-
156
-
157
-
158
-
159
-
160
-
161
-
162
-
163
-
164
-
165
-
166
-
167
-
168
-
169
-
170
-
171
-
172
-
173
-
174
-
175
-
176
-
177
-
178
-
179
-
180
-
181
-
182
-
183
-
184
-
185
-
186
-
187
-
188
-
189
-
190
-
191
-
192
-
193
-
194
-
195
-
196
-
197
-
198
-
199
-
200
-
201
-
202
-
203
-
204
-
205
-
206
-
207
-
208
-
209
-
210
-
211
-
212
-
213
-
 214
214 -
 215
215 -
 216
216 -
 217
217 -
 218
218 -
 219
219 -
 220
220 -
 221
221 -
 222
222 -
 223
223 -
 224
224 -
 225
225 -
 226
226 -
 227
227 -
 228
228 -
 229
229 -
 230
230 -
 231
231 -
 232
232 -
 233
233 -
 234
234 -
235
-
236
-
237
-
238
-
239
-
240
-
241
-
242
-
243
-
244
-
245
-
246
-
247
-
248
-
249
-
250
-
251
-
252
-
253
-
254
-
255
-
256
 |
 |

212
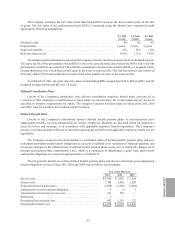
Additional benefit costs of $3.4 million related to the restructuring were recognized in restructuring expenses
in fiscal year 2009.
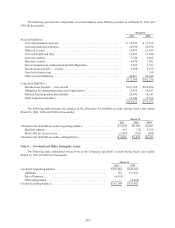
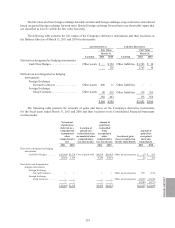
The changes in projected benefit obligations for fiscal years 2011 and 2010 were as follows (in thousands):
March 31,
2011 2010
Projected benefit obligation, beginning of year ...................... $57,531 $48,135
Service cost ............................................... 4,396 3,983
Interest cost ............................................... 1,745 1,430
Plan participant contributions ................................. 2,321 1,848
Actuarial (gain) loss......................................... 3,911 (78)
Benefits paid .............................................. (2,220)(1,037)
Plan amendments........................................... 19 —
Settlement................................................. (218) —
Administrative expense paid .................................. (131)(177)
Foreign currency exchange rate changes......................... 8,791 3,427
Projected benefit obligation, end of year............................ $76,145 $57,531
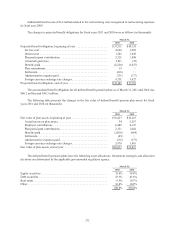
The accumulated benefit obligation for all defined benefit pension plans as of March 31, 2011 and 2010 was
$60.2 million and $46.3 million.
The following table presents the changes in the fair value of defined benefit pension plan assets for fiscal
years 2011 and 2010 (in thousands):
March 31,
2011 2010
Fair value of plan assets, beginning of year ......................... $35,427 $23,415
Actual return on plan assets................................... 34 5,267
Employer contributions ...................................... 4,409 4,137
Plan participant contributions ................................. 2,321 1,848
Benefits paid .............................................. (2,016)(864)
Settlement................................................. (85) —
Administrative expenses paid ................................. (131)(177)
Foreign currency exchange rate changes......................... 5,978 1,801
Fair value of plan assets, end of year............................... $45,937 $35,427
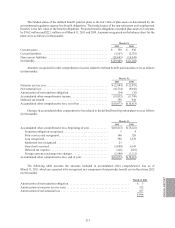
The defined benefit pension plans have the following asset allocations. Investment strategies and allocation
decisions are determined by the applicable governmental regulatory agency.
March 31,
2011 2010
Equity securities .............................................. 33.4%34.8%
Debt securities ............................................... 43.3%43.6%
Real estate ................................................... 6.5%10.7%
Other ....................................................... 16.8%10.9%
100.0%100.0%