Logitech 2011 Annual Report Download - page 225
Download and view the complete annual report
Please find page 225 of the 2011 Logitech annual report below. You can navigate through the pages in the report by either clicking on the pages listed below, or by using the keyword search tool below to find specific information within the annual report.-
 1
1 -
2
-
3
-
4
-
5
-
6
-
7
-
8
-
9
-
10
-
11
-
12
-
13
-
14
-
15
-
16
-
17
-
18
-
19
-
20
-
21
-
22
-
23
-
24
-
25
-
26
-
27
-
28
-
29
-
30
-
31
-
32
-
33
-
34
-
35
-
36
-
37
-
38
-
39
-
40
-
41
-
42
-
43
-
44
-
45
-
46
-
47
-
48
-
49
-
50
-
51
-
52
-
53
-
54
-
55
-
56
-
57
-
58
-
59
-
60
-
61
-
62
-
63
-
64
-
65
-
66
-
67
-
68
-
69
-
70
-
71
-
72
-
73
-
74
-
75
-
76
-
77
-
78
-
79
-
80
-
81
-
82
-
83
-
84
-
85
-
86
-
87
-
88
-
89
-
90
-
91
-
92
-
93
-
94
-
95
-
96
-
97
-
98
-
99
-
100
-
101
-
102
-
103
-
104
-
105
-
106
-
107
-
108
-
109
-
110
-
111
-
112
-
113
-
114
-
115
-
116
-
117
-
118
-
119
-
120
-
121
-
122
-
123
-
124
-
125
-
126
-
127
-
128
-
129
-
130
-
131
-
132
-
133
-
134
-
135
-
136
-
137
-
138
-
139
-
140
-
141
-
142
-
143
-
144
-
145
-
146
-
147
-
148
-
149
-
150
-
151
-
152
-
153
-
154
-
155
-
156
-
157
-
158
-
159
-
160
-
161
-
162
-
163
-
164
-
165
-
166
-
167
-
168
-
169
-
170
-
171
-
172
-
173
-
174
-
175
-
176
-
177
-
178
-
179
-
180
-
181
-
182
-
183
-
184
-
185
-
186
-
187
-
188
-
189
-
190
-
191
-
192
-
193
-
194
-
195
-
196
-
197
-
198
-
199
-
200
-
201
-
202
-
203
-
204
-
205
-
206
-
207
-
208
-
209
-
210
-
211
-
212
-
213
-
214
-
 215
215 -
 216
216 -
 217
217 -
 218
218 -
 219
219 -
 220
220 -
 221
221 -
 222
222 -
 223
223 -
 224
224 -
 225
225 -
 226
226 -
 227
227 -
 228
228 -
 229
229 -
 230
230 -
 231
231 -
 232
232 -
 233
233 -
 234
234 -
 235
235 -
236
-
237
-
238
-
239
-
240
-
241
-
242
-
243
-
244
-
245
-
246
-
247
-
248
-
249
-
250
-
251
-
252
-
253
-
254
-
255
-
256
 |
 |

ANNUAl REPORT
213
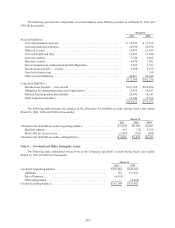
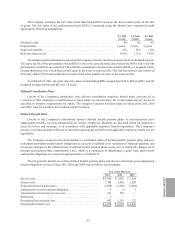
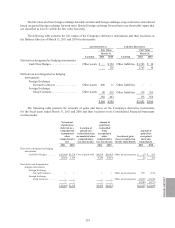
The funded status of the defined benefit pension plans is the fair value of plan assets as determined by the
governmental regulatory agency less benefit obligations. The funded status of the non-retirement post-employment
benefits is the fair value of the benefit obligations. Projected benefit obligations exceeded plan assets for all plans
by $30.2 million and $22.1 million as of March 31, 2011 and 2010. Amounts recognized on the balance sheet for the
plans were as follows (in thousands):
March 31,
2011 2010
Current assets ................................................ $759 $936
Current liabilities ............................................. (3,563)(2,761)
Non-current liabilities ......................................... (26,645)(19,343)
Net liability .................................................. $(29,449) $(21,168)
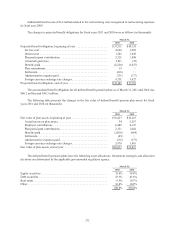
Amounts recognized in other comprehensive income related to defined benefit pension plans were as follows
(in thousands):
March 31,
2011 2010
Net prior service cost .......................................... $ (2,084) $ (2,075)
Net actuarial loss ............................................. (16,714)(9,641)
Amortization of net transition obligation ........................... (34)(33)
Accumulated other comprehensive income ......................... (18,832)(11,749)
Deferred tax benefit ........................................... 759 936
Accumulated other comprehensive loss, net of tax . . . . . . . . . . . . . . . . . . . $(18,073) $(10,813)
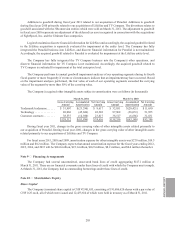
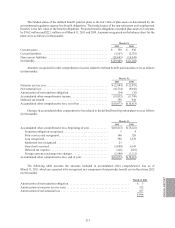
Changes in accumulated other comprehensive loss related to the defined benefit pension plans were as follows
(in thousands):
March 31,
2011 2010
Accumulated other comprehensive loss, beginning of year ............. $(10,813) $(15,122)
Transition obligation recognized ............................... 5 4
Prior service cost recognized.................................. 146 120
Loss recognized ............................................ 396 1,276
Settlement loss recognized ................................... 23 —
Gain (loss) occurred......................................... (5,609)4,143
Deferred tax expense ........................................ (241)(122)
Foreign currency exchange rate changes......................... (1,980)(1,112)
Accumulated other comprehensive loss, end of year .................. $(18,073) $(10,813)
The following table presents the amounts included in accumulated other comprehensive loss as of
March 31, 2011, which are expected to be recognized as a component of net periodic benefit cost in fiscal year 2012
(in thousands):
March 31, 2011
Amortization of net transition obligation .......................................... $ 5
Amortization of net prior service costs . . . . . . . . . . . . . . . . . . . . . . . . . . . . . . . . . . . . . . . . . . . 152
Amortization of net actuarial loss ............................................... 837
$994