Logitech 2011 Annual Report Download - page 208
Download and view the complete annual report
Please find page 208 of the 2011 Logitech annual report below. You can navigate through the pages in the report by either clicking on the pages listed below, or by using the keyword search tool below to find specific information within the annual report.-
 1
1 -
2
-
3
-
4
-
5
-
6
-
7
-
8
-
9
-
10
-
11
-
12
-
13
-
14
-
15
-
16
-
17
-
18
-
19
-
20
-
21
-
22
-
23
-
24
-
25
-
26
-
27
-
28
-
29
-
30
-
31
-
32
-
33
-
34
-
35
-
36
-
37
-
38
-
39
-
40
-
41
-
42
-
43
-
44
-
45
-
46
-
47
-
48
-
49
-
50
-
51
-
52
-
53
-
54
-
55
-
56
-
57
-
58
-
59
-
60
-
61
-
62
-
63
-
64
-
65
-
66
-
67
-
68
-
69
-
70
-
71
-
72
-
73
-
74
-
75
-
76
-
77
-
78
-
79
-
80
-
81
-
82
-
83
-
84
-
85
-
86
-
87
-
88
-
89
-
90
-
91
-
92
-
93
-
94
-
95
-
96
-
97
-
98
-
99
-
100
-
101
-
102
-
103
-
104
-
105
-
106
-
107
-
108
-
109
-
110
-
111
-
112
-
113
-
114
-
115
-
116
-
117
-
118
-
119
-
120
-
121
-
122
-
123
-
124
-
125
-
126
-
127
-
128
-
129
-
130
-
131
-
132
-
133
-
134
-
135
-
136
-
137
-
138
-
139
-
140
-
141
-
142
-
143
-
144
-
145
-
146
-
147
-
148
-
149
-
150
-
151
-
152
-
153
-
154
-
155
-
156
-
157
-
158
-
159
-
160
-
161
-
162
-
163
-
164
-
165
-
166
-
167
-
168
-
169
-
170
-
171
-
172
-
173
-
174
-
175
-
176
-
177
-
178
-
179
-
180
-
181
-
182
-
183
-
184
-
185
-
186
-
187
-
188
-
189
-
190
-
191
-
192
-
193
-
194
-
195
-
196
-
197
-
 198
198 -
 199
199 -
 200
200 -
 201
201 -
 202
202 -
 203
203 -
 204
204 -
 205
205 -
 206
206 -
 207
207 -
 208
208 -
 209
209 -
 210
210 -
 211
211 -
 212
212 -
 213
213 -
 214
214 -
 215
215 -
 216
216 -
 217
217 -
 218
218 -
219
-
220
-
221
-
222
-
223
-
224
-
225
-
226
-
227
-
228
-
229
-
230
-
231
-
232
-
233
-
234
-
235
-
236
-
237
-
238
-
239
-
240
-
241
-
242
-
243
-
244
-
245
-
246
-
247
-
248
-
249
-
250
-
251
-
252
-
253
-
254
-
255
-
256
 |
 |

196
Employee equity share options, non-vested shares and similar share-based compensation awards granted by
the Company are treated as potential shares in computing diluted net income per share. Diluted shares outstanding
include the dilutive effect of in-the-money share-based awards which is calculated based on the average share
price for each fiscal period using the treasury stock method. Under the treasury stock method, the amount that the
employee must pay for exercising share-based awards, the amount of compensation cost for future service that the
Company has not yet recognized, and the amount of tax impact that would be recorded in additional paid-in capital
when the award becomes deductible are assumed to be used to repurchase shares.
During fiscal years 2011, 2010 and 2009, 13,705,406, 15,186,997 and 10,567,217 share equivalents attributable
to outstanding stock options and RSUs were excluded from the calculation of diluted net income per share because
the combined exercise price, average unamortized fair value and assumed tax benefits upon exercise of these
options and RSUs were greater than the average market price of the Company’s shares, and therefore their inclusion
would have been anti-dilutive.
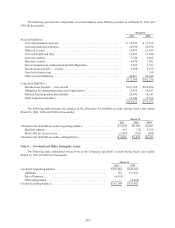
The following table illustrates the dilution effect of share-based awards granted, assumed and exercised
(in thousands):
Year ended March 31
2011 2010 2009
Basic weighted average shares outstanding as of March 31 . . . . . . . . . . . . 176,928 177,279 178,811
Stock options and RSUs granted . . . . . . . . . . . . . . . . . . . . . . . . . . . . . . . . . 2,431 3,902 4,239
Stock options and restricted stock assumed in LifeSize acquisition ...... —1,078 —
Stock options and RSUs canceled, forfeited, or expired . . . . . . . . . . . . . . . (1,411)(1,440)(1,163)
Net awards granted and assumed ................................. 1,020 3,540 3,076
Grant dilution(1) ............................................... 0.6%2.0%1.7%
Stock options exercised and RSUs vested . . . . . . . . . . . . . . . . . . . . . . . . . . 2,889 1,980 2,037
Exercise dilution(2). . . . . . . . . . . . . . . . . . . . . . . . . . . . . . . . . . . . . . . . . . . . . 1.6%1.1%1.1%
(1) The percentage of grant dilution is computed based on net awards granted and assumed as a percentage of
basic weighted average shares outstanding.
(2) The percentage of exercise dilution is computed based on options exercised as a percentage of basic weighted
average shares outstanding.
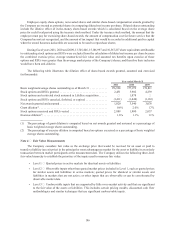
Note 4 — Fair Value Measurements
The Company considers fair value as the exchange price that would be received for an asset or paid to
transfer a liability (an exit price) in the principal or most advantageous market for the asset or liability in an orderly
transaction between market participants at the measurement date. The Company utilizes the following three-level
fair value hierarchy to establish the priorities of the inputs used to measure fair value:
• Level 1 — Quoted prices in active markets for identical assets or liabilities.
• Level 2 — Observable inputs other than quoted market prices included in Level 1, such as quoted prices
for similar assets and liabilities in active markets; quoted prices for identical or similar assets and
liabilities in markets that are not active; or other inputs that are observable or can be corroborated by
observable market data.
• Level 3 — Unobservable inputs that are supported by little or no market activity and that are significant
to the fair value of the assets or liabilities. This includes certain pricing models, discounted cash flow
methodologies and similar techniques that use significant unobservable inputs.