Logitech 2011 Annual Report Download - page 156
Download and view the complete annual report
Please find page 156 of the 2011 Logitech annual report below. You can navigate through the pages in the report by either clicking on the pages listed below, or by using the keyword search tool below to find specific information within the annual report.-
 1
1 -
2
-
3
-
4
-
5
-
6
-
7
-
8
-
9
-
10
-
11
-
12
-
13
-
14
-
15
-
16
-
17
-
18
-
19
-
20
-
21
-
22
-
23
-
24
-
25
-
26
-
27
-
28
-
29
-
30
-
31
-
32
-
33
-
34
-
35
-
36
-
37
-
38
-
39
-
40
-
41
-
42
-
43
-
44
-
45
-
46
-
47
-
48
-
49
-
50
-
51
-
52
-
53
-
54
-
55
-
56
-
57
-
58
-
59
-
60
-
61
-
62
-
63
-
64
-
65
-
66
-
67
-
68
-
69
-
70
-
71
-
72
-
73
-
74
-
75
-
76
-
77
-
78
-
79
-
80
-
81
-
82
-
83
-
84
-
85
-
86
-
87
-
88
-
89
-
90
-
91
-
92
-
93
-
94
-
95
-
96
-
97
-
98
-
99
-
100
-
101
-
102
-
103
-
104
-
105
-
106
-
107
-
108
-
109
-
110
-
111
-
112
-
113
-
114
-
115
-
116
-
117
-
118
-
119
-
120
-
121
-
122
-
123
-
124
-
125
-
126
-
127
-
128
-
129
-
130
-
131
-
132
-
133
-
134
-
135
-
136
-
137
-
138
-
139
-
140
-
141
-
142
-
143
-
144
-
145
-
 146
146 -
 147
147 -
 148
148 -
 149
149 -
 150
150 -
 151
151 -
 152
152 -
 153
153 -
 154
154 -
 155
155 -
 156
156 -
 157
157 -
 158
158 -
 159
159 -
 160
160 -
 161
161 -
 162
162 -
 163
163 -
 164
164 -
 165
165 -
 166
166 -
167
-
168
-
169
-
170
-
171
-
172
-
173
-
174
-
175
-
176
-
177
-
178
-
179
-
180
-
181
-
182
-
183
-
184
-
185
-
186
-
187
-
188
-
189
-
190
-
191
-
192
-
193
-
194
-
195
-
196
-
197
-
198
-
199
-
200
-
201
-
202
-
203
-
204
-
205
-
206
-
207
-
208
-
209
-
210
-
211
-
212
-
213
-
214
-
215
-
216
-
217
-
218
-
219
-
220
-
221
-
222
-
223
-
224
-
225
-
226
-
227
-
228
-
229
-
230
-
231
-
232
-
233
-
234
-
235
-
236
-
237
-
238
-
239
-
240
-
241
-
242
-
243
-
244
-
245
-
246
-
247
-
248
-
249
-
250
-
251
-
252
-
253
-
254
-
255
-
256
 |
 |
144
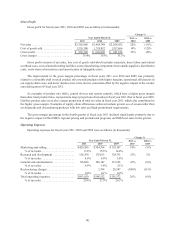
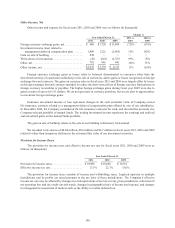
The increase in research and development expenses in fiscal year 2010 resulted from the addition of
research and development costs of LifeSize, which was acquired in fiscal year 2010. Personnel costs excluding
LifeSize increased in fiscal year 2010 in comparison with fiscal year 2009, when discretionary personnel costs
were reduced.
If foreign currency exchange rates had been the same in fiscal years 2011 and 2010, the change in constant
dollar research and development expense would have been 13%. The percentage change in constant dollar research
and development expense for fiscal year 2010 compared with 2009 would be the same as the change in U.S. dollars.
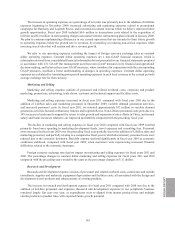
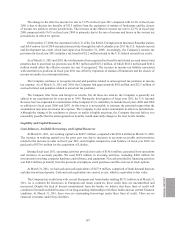
General and Administrative
General and administrative expense consists primarily of personnel and related overhead and facilities costs
for the finance, information systems, executive, human resources and legal functions.
General and administrative expense excluding LifeSize increased moderately in fiscal year 2011 compared
with 2010, primarily due to increased personnel expenses resulting from normal salary and bonus increases related
to our improved profitability compared with the preceding fiscal year.
General and administrative expense declined in fiscal year 2010, primarily due to a decrease of 5% in personnel
costs, as headcount was reduced. The headcount reduction was offset by the addition of LifeSize personnel in the
fourth quarter of fiscal year 2010. Decreases in travel and infrastructure expenses in fiscal year 2010 were partially
offset by $6.6 million in transaction costs related to the acquisition of LifeSize.
If foreign currency exchange rates had been the same in fiscal years 2011 and 2010, the percentage change in
constant dollar general and administrative expenses would be the same as the percentage change in U.S. dollars.
If foreign currency exchange rates had been the same in fiscal years 2010 and 2009, the percentage decrease in
constant dollar general and administrative expense for fiscal year 2010 would have been 7%.
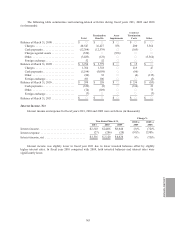
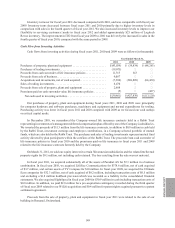
Restructuring Charges
Restructuring charges represent the costs associated with a restructuring plan initiated in January 2009, and
consist of termination benefits to approximately 500 employees, pension plan curtailment and settlement costs,
exit costs associated with the closure of existing facilities, and write-downs of fixed assets that were not placed in
service due to the abandonment of the related projects. The restructuring was completed as of March 31, 2010.