Logitech 2011 Annual Report Download - page 111
Download and view the complete annual report
Please find page 111 of the 2011 Logitech annual report below. You can navigate through the pages in the report by either clicking on the pages listed below, or by using the keyword search tool below to find specific information within the annual report.-
 1
1 -
2
-
3
-
4
-
5
-
6
-
7
-
8
-
9
-
10
-
11
-
12
-
13
-
14
-
15
-
16
-
17
-
18
-
19
-
20
-
21
-
22
-
23
-
24
-
25
-
26
-
27
-
28
-
29
-
30
-
31
-
32
-
33
-
34
-
35
-
36
-
37
-
38
-
39
-
40
-
41
-
42
-
43
-
44
-
45
-
46
-
47
-
48
-
49
-
50
-
51
-
52
-
53
-
54
-
55
-
56
-
57
-
58
-
59
-
60
-
61
-
62
-
63
-
64
-
65
-
66
-
67
-
68
-
69
-
70
-
71
-
72
-
73
-
74
-
75
-
76
-
77
-
78
-
79
-
80
-
81
-
82
-
83
-
84
-
85
-
86
-
87
-
88
-
89
-
90
-
91
-
92
-
93
-
94
-
95
-
96
-
97
-
98
-
99
-
100
-
 101
101 -
 102
102 -
 103
103 -
 104
104 -
 105
105 -
 106
106 -
 107
107 -
 108
108 -
 109
109 -
 110
110 -
 111
111 -
 112
112 -
 113
113 -
 114
114 -
 115
115 -
 116
116 -
 117
117 -
 118
118 -
 119
119 -
 120
120 -
 121
121 -
122
-
123
-
124
-
125
-
126
-
127
-
128
-
129
-
130
-
131
-
132
-
133
-
134
-
135
-
136
-
137
-
138
-
139
-
140
-
141
-
142
-
143
-
144
-
145
-
146
-
147
-
148
-
149
-
150
-
151
-
152
-
153
-
154
-
155
-
156
-
157
-
158
-
159
-
160
-
161
-
162
-
163
-
164
-
165
-
166
-
167
-
168
-
169
-
170
-
171
-
172
-
173
-
174
-
175
-
176
-
177
-
178
-
179
-
180
-
181
-
182
-
183
-
184
-
185
-
186
-
187
-
188
-
189
-
190
-
191
-
192
-
193
-
194
-
195
-
196
-
197
-
198
-
199
-
200
-
201
-
202
-
203
-
204
-
205
-
206
-
207
-
208
-
209
-
210
-
211
-
212
-
213
-
214
-
215
-
216
-
217
-
218
-
219
-
220
-
221
-
222
-
223
-
224
-
225
-
226
-
227
-
228
-
229
-
230
-
231
-
232
-
233
-
234
-
235
-
236
-
237
-
238
-
239
-
240
-
241
-
242
-
243
-
244
-
245
-
246
-
247
-
248
-
249
-
250
-
251
-
252
-
253
-
254
-
255
-
256
 |
 |

99
ENglISH
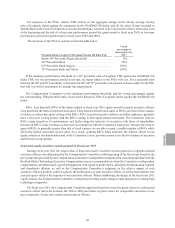
For purposes of the PSUs, relative TSR reflects (i) the aggregate change in the 30-day average closing
price of Logitech shares against the companies in the NASDAQ 100 Index, and (ii) the value (if any) returned to
shareholders in the form of dividends or similar distributions, assumed to be reinvested in shares when paid, each
at the beginning and the end of a three-year performance period (for grants made in fiscal year 2011) or two-year
performance period (for grants made in fiscal years 2009 and 2010).
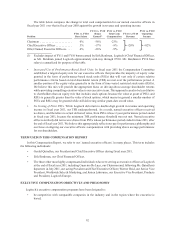
The structure of the PSUs is summarized in the table below:
Percentile Rank of Logitech TSR against Nasdaq 100 Index TSR
Vested
percentage of
shares subject to
PSU
Below 40th Percentile Rank (threshold) . . . . . . . . . . . . . . . . 0%
40th Percentile Rank ............................... 50%
60th Percentile Rank (target) ......................... 100%
75th Percentile Rank and Above . . . . . . . . . . . . . . . . . . . . . . 200%
If the minimum performance threshold of a 40th percentile rank of Logitech TSR against the NASDAQ 100
Index TSR over the performance period is not met, no shares subject to the PSUs will vest. For a percentile rank
between the 40th and 60th percentiles, or between the 60th and 75th percentiles, the percent of shares subject to the PSU
that will vest will be determined by straight-line interpolation.
The Compensation Committee set the minimum performance threshold, and the vested percentages against
the corresponding TSR percentile ranks, based on the historical TSR of Logitech shares against the NASDAQ 100
Index.
RSUs. Less than half (40%) of the shares subject to fiscal year 2011 equity awards to named executive officers
were granted in the form of restricted stock units. Time-based restricted stock units, or RSUs, provide for the issuance
of shares at a future date upon vesting of the RSUs. RSUs issued to executive officers and other employees generally
have a four-year vesting period, with the RSUs vesting in four equal annual increments. The Committee believes
RSUs create incentives for performance and further align the interests of executives with those of shareholders
because an RSU’s value increases or decreases in conjunction with the Company’s stock price. Because the value at
grant of RSUs is generally greater than that of stock options, we are able to grant a smaller number of RSUs while
delivering similar grant-date award value. As a result, granting RSUs helps minimize the dilutive effects of our
equity awards on our shareholders and, in the Committee’s view, provides a more cost effective balance of incentive
and risk than stock options.
Long-term equity incentive awards granted in fiscal year 2011
During fiscal year 2011 the target value of long-term equity incentive awards granted to Logitech’s named
executive officers was determined by the Compensation Committee at the beginning of the fiscal year based on the
peer group data provided by the Compensation Committee’s independent compensation consultant and data from the
Radford Global Technology Executive Compensation survey, recommendations from the Committee’s independent
compensation consultant and Logitech management with regard to grant values, anticipated compensation expense
and shareholder dilution, as well as the Compensation Committee’s judgment on the relative impact of each
executive officer’s position within Logitech, the performance of each executive officer, as well as the relatively low
accrued equity value of the majority of our executive officers. When establishing the design of the fiscal year 2011
equity awards, the Compensation Committee considered prevailing equity design trends and practices among high
technology companies.
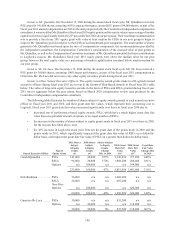
For fiscal year 2011, the Compensation Committee approved long-term incentive grant values for each named
executive officer that were between the 25th to 50th percentiles of grant values for comparable executives at our
peer companies. Grants were made in particular as follows: