Logitech 2011 Annual Report Download - page 171
Download and view the complete annual report
Please find page 171 of the 2011 Logitech annual report below. You can navigate through the pages in the report by either clicking on the pages listed below, or by using the keyword search tool below to find specific information within the annual report.-
 1
1 -
2
-
3
-
4
-
5
-
6
-
7
-
8
-
9
-
10
-
11
-
12
-
13
-
14
-
15
-
16
-
17
-
18
-
19
-
20
-
21
-
22
-
23
-
24
-
25
-
26
-
27
-
28
-
29
-
30
-
31
-
32
-
33
-
34
-
35
-
36
-
37
-
38
-
39
-
40
-
41
-
42
-
43
-
44
-
45
-
46
-
47
-
48
-
49
-
50
-
51
-
52
-
53
-
54
-
55
-
56
-
57
-
58
-
59
-
60
-
61
-
62
-
63
-
64
-
65
-
66
-
67
-
68
-
69
-
70
-
71
-
72
-
73
-
74
-
75
-
76
-
77
-
78
-
79
-
80
-
81
-
82
-
83
-
84
-
85
-
86
-
87
-
88
-
89
-
90
-
91
-
92
-
93
-
94
-
95
-
96
-
97
-
98
-
99
-
100
-
101
-
102
-
103
-
104
-
105
-
106
-
107
-
108
-
109
-
110
-
111
-
112
-
113
-
114
-
115
-
116
-
117
-
118
-
119
-
120
-
121
-
122
-
123
-
124
-
125
-
126
-
127
-
128
-
129
-
130
-
131
-
132
-
133
-
134
-
135
-
136
-
137
-
138
-
139
-
140
-
141
-
142
-
143
-
144
-
145
-
146
-
147
-
148
-
149
-
150
-
151
-
152
-
153
-
154
-
155
-
156
-
157
-
158
-
159
-
160
-
 161
161 -
 162
162 -
 163
163 -
 164
164 -
 165
165 -
 166
166 -
 167
167 -
 168
168 -
 169
169 -
 170
170 -
 171
171 -
 172
172 -
 173
173 -
 174
174 -
 175
175 -
 176
176 -
 177
177 -
 178
178 -
 179
179 -
 180
180 -
 181
181 -
182
-
183
-
184
-
185
-
186
-
187
-
188
-
189
-
190
-
191
-
192
-
193
-
194
-
195
-
196
-
197
-
198
-
199
-
200
-
201
-
202
-
203
-
204
-
205
-
206
-
207
-
208
-
209
-
210
-
211
-
212
-
213
-
214
-
215
-
216
-
217
-
218
-
219
-
220
-
221
-
222
-
223
-
224
-
225
-
226
-
227
-
228
-
229
-
230
-
231
-
232
-
233
-
234
-
235
-
236
-
237
-
238
-
239
-
240
-
241
-
242
-
243
-
244
-
245
-
246
-
247
-
248
-
249
-
250
-
251
-
252
-
253
-
254
-
255
-
256
 |
 |

ANNUAl REPORT
159
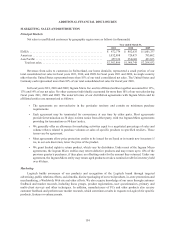
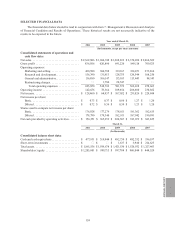
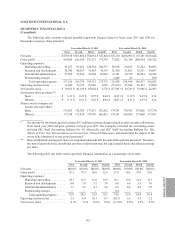
SELECTED FINANCIAL DATA
The financial data below should be read in conjunction with Item 7 “Management’s Discussion and Analysis
of Financial Condition and Results of Operations.” These historical results are not necessarily indicative of the
results to be expected in the future.
Year ended March 31,
2011 2010 2009 2008 2007
(In thousands, except per share amounts)
Consolidated statements of operations and
cash flow data:
Net sales................................. $2,362,886 $1,966,748 $2,208,832 $2,370,496 $2,066,569
Gross profit .............................. 836,506 626,896 691,226 849,118 709,525
Operating expenses:
Marketing and selling.................... 420,580 304,788 319,167 324,451 272,264
Research and development................ 156,390 135,813 128,755 124,544 108,256
General and administrative................ 116,880 106,147 113,103 113,443 98,143
Restructuring charges.................... — 1,784 20,547 — —
Total operating expenses .............. 693,850 548,532 581,572 562,438 478,663
Operating income ......................... 142,656 78,364 109,654 286,680 230,862
Net income............................... $128,460 $64,957 $107,032 $231,026 $229,848
Net income per share:
Basic................................. $0.73 $0.37 $0.60 $1.27 $1.26
Diluted ............................... $0.72 $0.36 $0.59 $1.23 $1.20
Shares used to compute net income per share:
Basic................................. 176,928 177,279 178,811 181,362 182,635
Diluted ............................... 178,790 179,340 182,911 187,942 190,991
Net cash provided by operating activities ....... $156,551 $365,259 $200,587 $393,079 $303,825
March 31,
2011 2010 2009 2008 2007
(In thousands)
Consolidated balance sheet data:
Cash and cash equivalents................... $477,931 $319,944 $492,759 $482,352 $196,197
Short-term investments . . . . . . . . . . . . . . . . . . . . . $ — $ — $ 1,637 $3,940 $214,625
Total assets............................... $1,861,556 $1,599,678 $1,421,530 $1,526,932 $1,327,463
Shareholders’ equity ....................... $1,205,001 $999,715 $997,708 $960,044 $844,524