Logitech 2011 Annual Report Download - page 143
Download and view the complete annual report
Please find page 143 of the 2011 Logitech annual report below. You can navigate through the pages in the report by either clicking on the pages listed below, or by using the keyword search tool below to find specific information within the annual report.-
 1
1 -
2
-
3
-
4
-
5
-
6
-
7
-
8
-
9
-
10
-
11
-
12
-
13
-
14
-
15
-
16
-
17
-
18
-
19
-
20
-
21
-
22
-
23
-
24
-
25
-
26
-
27
-
28
-
29
-
30
-
31
-
32
-
33
-
34
-
35
-
36
-
37
-
38
-
39
-
40
-
41
-
42
-
43
-
44
-
45
-
46
-
47
-
48
-
49
-
50
-
51
-
52
-
53
-
54
-
55
-
56
-
57
-
58
-
59
-
60
-
61
-
62
-
63
-
64
-
65
-
66
-
67
-
68
-
69
-
70
-
71
-
72
-
73
-
74
-
75
-
76
-
77
-
78
-
79
-
80
-
81
-
82
-
83
-
84
-
85
-
86
-
87
-
88
-
89
-
90
-
91
-
92
-
93
-
94
-
95
-
96
-
97
-
98
-
99
-
100
-
101
-
102
-
103
-
104
-
105
-
106
-
107
-
108
-
109
-
110
-
111
-
112
-
113
-
114
-
115
-
116
-
117
-
118
-
119
-
120
-
121
-
122
-
123
-
124
-
125
-
126
-
127
-
128
-
129
-
130
-
131
-
132
-
 133
133 -
 134
134 -
 135
135 -
 136
136 -
 137
137 -
 138
138 -
 139
139 -
 140
140 -
 141
141 -
 142
142 -
 143
143 -
 144
144 -
 145
145 -
 146
146 -
 147
147 -
 148
148 -
 149
149 -
 150
150 -
 151
151 -
 152
152 -
 153
153 -
154
-
155
-
156
-
157
-
158
-
159
-
160
-
161
-
162
-
163
-
164
-
165
-
166
-
167
-
168
-
169
-
170
-
171
-
172
-
173
-
174
-
175
-
176
-
177
-
178
-
179
-
180
-
181
-
182
-
183
-
184
-
185
-
186
-
187
-
188
-
189
-
190
-
191
-
192
-
193
-
194
-
195
-
196
-
197
-
198
-
199
-
200
-
201
-
202
-
203
-
204
-
205
-
206
-
207
-
208
-
209
-
210
-
211
-
212
-
213
-
214
-
215
-
216
-
217
-
218
-
219
-
220
-
221
-
222
-
223
-
224
-
225
-
226
-
227
-
228
-
229
-
230
-
231
-
232
-
233
-
234
-
235
-
236
-
237
-
238
-
239
-
240
-
241
-
242
-
243
-
244
-
245
-
246
-
247
-
248
-
249
-
250
-
251
-
252
-
253
-
254
-
255
-
256
 |
 |

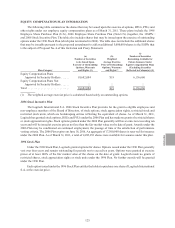
ANNUAl REPORT
131
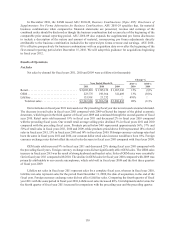
Retail sales in fiscal year 2011 increased 15% and retail units increased 19% compared with fiscal year 2010,
with increases in all product families except gaming. Our overall retail average selling price in fiscal year 2011
declined 3% compared with fiscal year 2010, as unit sales of our retail products priced below $40 increased more
than other price bands.
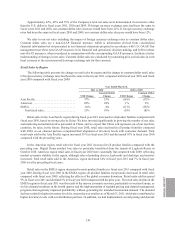
Retail sales in our Asia Pacific and AMR regions increased 37% and 28% in fiscal year 2011 compared with
fiscal year 2010. Retail sales in our EMEA region decreased 2% in the same period, reflecting a disappointing
decline of 17% in the fourth quarter of fiscal year 2011 compared with the fourth quarter of fiscal year 2010. The
weakness in the EMEA region in the fourth quarter of fiscal year 2011 was due to lower than expected demand and
poor execution of pricing and channel programs in Europe.
OEM sales increased 13% in fiscal year 2011 compared with fiscal year 2010, and OEM units sold increased
9%, primarily due to increased keyboard sales.
Sales of LifeSize Communications products were 6% of total net sales in fiscal year 2011. In fiscal year 2010,
LifeSize sales were included in our financial results from December 9, 2009, the date of acquisition, to the end of
the fiscal year.
Our gross margin for fiscal year 2011 was 35.4% compared with 31.9% in the prior fiscal year, primarily due
to the a favorable shift in product mix towards products with higher margin, operational efficiencies in our supply
chain costs, and lower obsolescence write-downs, somewhat offset by the negative impact of the weaker euro
during most of fiscal year 2011. Our gross margin for fiscal year 2011 would have been higher but for weak sales
and profitability in our EMEA retail region in the fourth quarter. Operating expenses for fiscal year 2011 were
29.4% of net sales compared with 27.9% in fiscal year 2010. The increase in operating expenses was primarily due
to the addition of LifeSize in December 2009, increased advertising and marketing expenses related to promotional
campaigns for Harmony and Logitech Revue, and increased investment in areas of future growth opportunities,
such as China.
Net income for the year ended March 31, 2011 was $128.5 million, compared with net income of $65.0 million
in fiscal year 2010. The increase in net income was primarily due to increased sales and improved gross margin,
somewhat offset by the increase in operating expenses.
Trends in Our Business
Our sales of PC peripherals for use by consumers in the Americas and Europe have historically made up the
large majority of our revenues. The increasing popularity of smaller, mobile computing devices such as tablets and
smartphones with touch interfaces and the declining popularity of desktop PCs is rapidly changing the PC market.
Consumer demand for PCs is decelerating in our traditional, mature markets such as North America, Western and
Nordic Europe, Japan, Australia, and New Zealand, and we believe sales of our PC peripherals in mature markets
will decline in fiscal year 2012 and potentially beyond. We believe there are continued growth opportunities for our
PC peripherals outside the more mature markets of the Americas and Europe. We also believe there are significant
opportunities to sell products to consumers to help make their tablets and other mobile devices more productive
and comfortable. However, we only recently introduced our product line for tablets, and consumer acceptance and
demand for peripherals for use with tablets and other mobile computing devices is still uncertain. We believe our
future sales growth will be significantly impacted by our ability to grow sales in emerging markets such as China,
to grow our LifeSize videoconferencing division, and to develop sales and innovations for our emerging product
categories which are not PC-dependent, such as our products for tablets and the Google TV platform.
Our overall corporate strategy for future growth includes increasing our presence and sales in emerging
markets, which we anticipate will be the high growth markets of the future as sales growth decelerates in our
traditional, mature markets. We are currently investing significantly in growing the number of our sales, marketing
and administrative personnel in China, and we expect that China may represent one of our top three countries, by