Logitech 2011 Annual Report Download - page 115
Download and view the complete annual report
Please find page 115 of the 2011 Logitech annual report below. You can navigate through the pages in the report by either clicking on the pages listed below, or by using the keyword search tool below to find specific information within the annual report.-
 1
1 -
2
-
3
-
4
-
5
-
6
-
7
-
8
-
9
-
10
-
11
-
12
-
13
-
14
-
15
-
16
-
17
-
18
-
19
-
20
-
21
-
22
-
23
-
24
-
25
-
26
-
27
-
28
-
29
-
30
-
31
-
32
-
33
-
34
-
35
-
36
-
37
-
38
-
39
-
40
-
41
-
42
-
43
-
44
-
45
-
46
-
47
-
48
-
49
-
50
-
51
-
52
-
53
-
54
-
55
-
56
-
57
-
58
-
59
-
60
-
61
-
62
-
63
-
64
-
65
-
66
-
67
-
68
-
69
-
70
-
71
-
72
-
73
-
74
-
75
-
76
-
77
-
78
-
79
-
80
-
81
-
82
-
83
-
84
-
85
-
86
-
87
-
88
-
89
-
90
-
91
-
92
-
93
-
94
-
95
-
96
-
97
-
98
-
99
-
100
-
101
-
102
-
103
-
104
-
 105
105 -
 106
106 -
 107
107 -
 108
108 -
 109
109 -
 110
110 -
 111
111 -
 112
112 -
 113
113 -
 114
114 -
 115
115 -
 116
116 -
 117
117 -
 118
118 -
 119
119 -
 120
120 -
 121
121 -
 122
122 -
 123
123 -
 124
124 -
 125
125 -
126
-
127
-
128
-
129
-
130
-
131
-
132
-
133
-
134
-
135
-
136
-
137
-
138
-
139
-
140
-
141
-
142
-
143
-
144
-
145
-
146
-
147
-
148
-
149
-
150
-
151
-
152
-
153
-
154
-
155
-
156
-
157
-
158
-
159
-
160
-
161
-
162
-
163
-
164
-
165
-
166
-
167
-
168
-
169
-
170
-
171
-
172
-
173
-
174
-
175
-
176
-
177
-
178
-
179
-
180
-
181
-
182
-
183
-
184
-
185
-
186
-
187
-
188
-
189
-
190
-
191
-
192
-
193
-
194
-
195
-
196
-
197
-
198
-
199
-
200
-
201
-
202
-
203
-
204
-
205
-
206
-
207
-
208
-
209
-
210
-
211
-
212
-
213
-
214
-
215
-
216
-
217
-
218
-
219
-
220
-
221
-
222
-
223
-
224
-
225
-
226
-
227
-
228
-
229
-
230
-
231
-
232
-
233
-
234
-
235
-
236
-
237
-
238
-
239
-
240
-
241
-
242
-
243
-
244
-
245
-
246
-
247
-
248
-
249
-
250
-
251
-
252
-
253
-
254
-
255
-
256
 |
 |

103
ENglISH
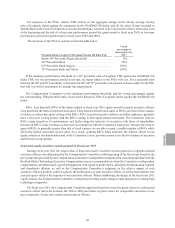
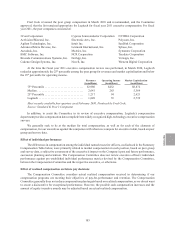
Fred Cook reviewed the peer group composition in March 2010 and recommended, and the Committee
approved, that the list remained appropriate for Logitech for fiscal year 2011 executive compensation. For fiscal
year 2011, the peer companies consisted of:
3Com Corporation Cypress Semiconductor Corporation NVIDIA Corporation
Activision Blizzard, Inc. Electronic Arts, Inc. Polycom, Inc.
Agilent Technologies, Inc. Intuit Inc. SanDisk Corporation
Advanced Micro Devices, Inc. Lexmark International, Inc. Sybase, Inc.
Autodesk, Inc. McAfee, Inc. Symantec Corporation
BMC Software, Inc. NCR Corporation Teradata Corporation
Brocade Communications Systems, Inc. NetApp, Inc. Verisign, Inc.
Cadence Design Systems, Inc. Novell, Inc. Western Digital Corporation
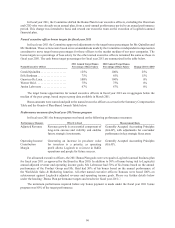
At the time the fiscal year 2011 executive compensation review was performed, in March 2010, Logitech
ranked at approximately the 25th percentile among the peer group for revenues and market capitalization and below
the 25th percentile for operating income.
Revenues
(in millions) Operating Income
(in millions) Market Capitalization
(in millions)
75th Percentile . . . . . . . . . . . . . . . . . . . . . . . . . . . $3,980 $432 $8,872
Median ................................ 2,641 263 5,369
25th Percentile ........................... 1,217 94 2,621
Logitech ............................... 1,849 35 2,739
Most recently available four quarters as of February 2010. Produced by Fred Cook,
Source: Standard & Poor’s Compustat
In addition, to assist the Committee in its review of executive compensation, Logitech’s compensation
department provides compensation data compiled from widely recognized high-technology executive compensation
surveys.
We generally seek to be at the median for total compensation, as well as for each of the elements of
compensation, for our executives against the companies with whom we compete for executive talent, based on peer
group and survey data.
Effect of individual performance
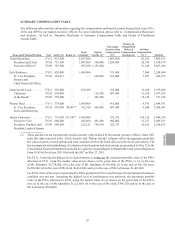
The differences in compensation among the individual named executive officers, as disclosed in the Summary
Compensation Table below, were primarily related to market compensation in each position, based on peer group
and survey data, a subjective assessment of the executive’s impact on the Company’s past and future performance,
succession planning and retention. The Compensation Committee does not review executive officers’ individual
performance against pre-established individual performance metrics devised by the Compensation Committee,
between the Compensation Committee and the respective executive, or otherwise.
Effect of realized compensation on future pay decisions
The Compensation Committee considers actual realized compensation received in determining if our
compensation programs are meeting their objectives of pay-for-performance and retention. The Compensation
Committee generally does not reduce compensation plan targets based on realized compensation, as we do not want
to create a disincentive for exceptional performance. However, the possible cash compensation increases and the
amount of equity incentive awards may be adjusted based on actual realized compensation.