Logitech 2011 Annual Report Download - page 158
Download and view the complete annual report
Please find page 158 of the 2011 Logitech annual report below. You can navigate through the pages in the report by either clicking on the pages listed below, or by using the keyword search tool below to find specific information within the annual report.-
 1
1 -
2
-
3
-
4
-
5
-
6
-
7
-
8
-
9
-
10
-
11
-
12
-
13
-
14
-
15
-
16
-
17
-
18
-
19
-
20
-
21
-
22
-
23
-
24
-
25
-
26
-
27
-
28
-
29
-
30
-
31
-
32
-
33
-
34
-
35
-
36
-
37
-
38
-
39
-
40
-
41
-
42
-
43
-
44
-
45
-
46
-
47
-
48
-
49
-
50
-
51
-
52
-
53
-
54
-
55
-
56
-
57
-
58
-
59
-
60
-
61
-
62
-
63
-
64
-
65
-
66
-
67
-
68
-
69
-
70
-
71
-
72
-
73
-
74
-
75
-
76
-
77
-
78
-
79
-
80
-
81
-
82
-
83
-
84
-
85
-
86
-
87
-
88
-
89
-
90
-
91
-
92
-
93
-
94
-
95
-
96
-
97
-
98
-
99
-
100
-
101
-
102
-
103
-
104
-
105
-
106
-
107
-
108
-
109
-
110
-
111
-
112
-
113
-
114
-
115
-
116
-
117
-
118
-
119
-
120
-
121
-
122
-
123
-
124
-
125
-
126
-
127
-
128
-
129
-
130
-
131
-
132
-
133
-
134
-
135
-
136
-
137
-
138
-
139
-
140
-
141
-
142
-
143
-
144
-
145
-
146
-
147
-
 148
148 -
 149
149 -
 150
150 -
 151
151 -
 152
152 -
 153
153 -
 154
154 -
 155
155 -
 156
156 -
 157
157 -
 158
158 -
 159
159 -
 160
160 -
 161
161 -
 162
162 -
 163
163 -
 164
164 -
 165
165 -
 166
166 -
 167
167 -
 168
168 -
169
-
170
-
171
-
172
-
173
-
174
-
175
-
176
-
177
-
178
-
179
-
180
-
181
-
182
-
183
-
184
-
185
-
186
-
187
-
188
-
189
-
190
-
191
-
192
-
193
-
194
-
195
-
196
-
197
-
198
-
199
-
200
-
201
-
202
-
203
-
204
-
205
-
206
-
207
-
208
-
209
-
210
-
211
-
212
-
213
-
214
-
215
-
216
-
217
-
218
-
219
-
220
-
221
-
222
-
223
-
224
-
225
-
226
-
227
-
228
-
229
-
230
-
231
-
232
-
233
-
234
-
235
-
236
-
237
-
238
-
239
-
240
-
241
-
242
-
243
-
244
-
245
-
246
-
247
-
248
-
249
-
250
-
251
-
252
-
253
-
254
-
255
-
256
 |
 |

146
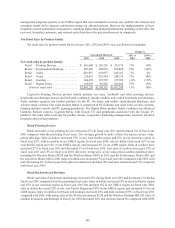
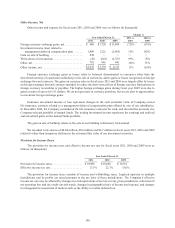
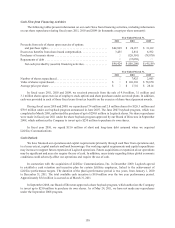
Other Income, Net
Other income and expense for fiscal years 2011, 2010 and 2009 were as follows (in thousands):
Year Ended March 31, Change %
2011 vs
2010 2010 vs
2009 2011 2010 2009
Foreign currency exchange gains, net . . . . . . . . . . . . $ 480 $1,720 $13,680 (72)% (87)%
Investment income (loss) related to
management deferred compensation plan . . . . . . 1,409 1,221 (2,883)15%142%
Gain on sale of building . . . . . . . . . . . . . . . . . . . . . . . 838 — — — —
Write-down of investments . . . . . . . . . . . . . . . . . . . . (43)(643)(2,727)93%76%
Other, net .................................. 792 841 441 (6)% 91%
Other income, net ............................ $3,476 $3,139 $8,511 11%(63)%
Foreign currency exchange gains or losses relate to balances denominated in currencies other than the
functional currency of a particular subsidiary, to the sale of currencies, and to gains or losses recognized on foreign
exchange forward contracts. The gains on currency sales in fiscal years 2011 and 2010 were largely offset by losses
on foreign exchange forward contracts intended to reduce the short-term effects of foreign currency fluctuations on
foreign currency receivables or payables. The higher foreign exchange gains during fiscal year 2009 were due to
gains on sales of euros for U.S. dollars. We do not speculate in currency positions, but we are alert to opportunities
to maximize foreign exchange gains.
Insurance investment income or loss represents changes in the cash surrender value of Company-owned
life insurance contracts related to a management deferred compensation plan offered by one of our subsidiaries.
In December 2010, the Company surrendered the life insurance contracts for cash, and invested the proceeds in a
Company-selected portfolio of mutual funds. The trading investment income represents the earnings and realized
and unrealized gains on the mutual funds portfolio.
The gain on sale of building relates to the sale of our building in Romanel, Switzerland.
We recorded write-downs of $0.04 million, $0.6 million and $2.7 million in fiscal years 2011, 2010 and 2009
related to other-than-temporary declines in the estimated fair value of our investment securities.
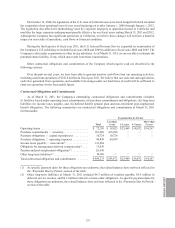
Provision for Income Taxes
The provision for income taxes and effective income tax rate for fiscal years 2011, 2010 and 2009 were as
follows (in thousands):
Year Ended March 31,
2011 2010 2009
Provision for income taxes ..................... $19,988 $18,666 $19,761
Effective income tax rate . . . . . . . . . . . . . . . . . . . . . . 13.5%22.3%15.6%
The provision for income taxes consists of income and withholding taxes. Logitech operates in multiple
jurisdictions and its profits are taxed pursuant to the tax laws of these jurisdictions. The Company’s effective
income tax rate may be affected by changes in or interpretations of tax laws in any given jurisdiction, utilization of
net operating loss and tax credit carryforwards, changes in geographical mix of income and expense, and changes
in management’s assessment of matters such as the ability to realize deferred tax.