Logitech 2011 Annual Report Download - page 126
Download and view the complete annual report
Please find page 126 of the 2011 Logitech annual report below. You can navigate through the pages in the report by either clicking on the pages listed below, or by using the keyword search tool below to find specific information within the annual report.-
 1
1 -
2
-
3
-
4
-
5
-
6
-
7
-
8
-
9
-
10
-
11
-
12
-
13
-
14
-
15
-
16
-
17
-
18
-
19
-
20
-
21
-
22
-
23
-
24
-
25
-
26
-
27
-
28
-
29
-
30
-
31
-
32
-
33
-
34
-
35
-
36
-
37
-
38
-
39
-
40
-
41
-
42
-
43
-
44
-
45
-
46
-
47
-
48
-
49
-
50
-
51
-
52
-
53
-
54
-
55
-
56
-
57
-
58
-
59
-
60
-
61
-
62
-
63
-
64
-
65
-
66
-
67
-
68
-
69
-
70
-
71
-
72
-
73
-
74
-
75
-
76
-
77
-
78
-
79
-
80
-
81
-
82
-
83
-
84
-
85
-
86
-
87
-
88
-
89
-
90
-
91
-
92
-
93
-
94
-
95
-
96
-
97
-
98
-
99
-
100
-
101
-
102
-
103
-
104
-
105
-
106
-
107
-
108
-
109
-
110
-
111
-
112
-
113
-
114
-
115
-
 116
116 -
 117
117 -
 118
118 -
 119
119 -
 120
120 -
 121
121 -
 122
122 -
 123
123 -
 124
124 -
 125
125 -
 126
126 -
 127
127 -
 128
128 -
 129
129 -
 130
130 -
 131
131 -
 132
132 -
 133
133 -
 134
134 -
 135
135 -
 136
136 -
137
-
138
-
139
-
140
-
141
-
142
-
143
-
144
-
145
-
146
-
147
-
148
-
149
-
150
-
151
-
152
-
153
-
154
-
155
-
156
-
157
-
158
-
159
-
160
-
161
-
162
-
163
-
164
-
165
-
166
-
167
-
168
-
169
-
170
-
171
-
172
-
173
-
174
-
175
-
176
-
177
-
178
-
179
-
180
-
181
-
182
-
183
-
184
-
185
-
186
-
187
-
188
-
189
-
190
-
191
-
192
-
193
-
194
-
195
-
196
-
197
-
198
-
199
-
200
-
201
-
202
-
203
-
204
-
205
-
206
-
207
-
208
-
209
-
210
-
211
-
212
-
213
-
214
-
215
-
216
-
217
-
218
-
219
-
220
-
221
-
222
-
223
-
224
-
225
-
226
-
227
-
228
-
229
-
230
-
231
-
232
-
233
-
234
-
235
-
236
-
237
-
238
-
239
-
240
-
241
-
242
-
243
-
244
-
245
-
246
-
247
-
248
-
249
-
250
-
251
-
252
-
253
-
254
-
255
-
256
 |
 |

114
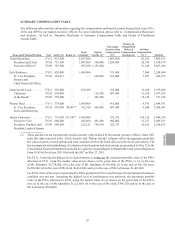
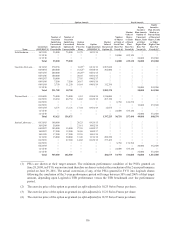
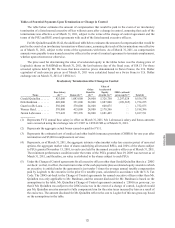
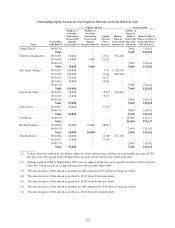
GRANTS OF PLAN-BASED AWARDS IN FISCAL YEAR 2011
The following table sets forth certain information regarding grants of plan-based awards to each of our
named executive officers during fiscal year 2011. For more information, please refer to “Compensation Disclosure
and Analysis.”
Name Type Grant Date
(MM/DD/YY) Approval
Date
Estimated Possible Payouts
Under Non-Equity Incentive
Plan Awards (1)
Estimated Future Payouts
Under Equity Incentive
Plan Awards (3)
All Other
Stock
Awards:
Number of
Shares of
Stock
or Units
(#) (4)
Grant
Date Fair
Value
($) (5)
Threshold
($) Target
($) Maximum
($) Actual
($) (2) Threshold
(#) Target
(#) Maximum
(#)
Gerald Quindlen ... PSU 11/15/10 11/13/10 70,500 141,000 282,000 — 3,926,850
RSU 11/15/10 11/13/10 — — — 94,000 1,908,200
FY11 Bonus N/A N/A 721,875 1,031,250 2,062,500 1,083,000
Erik Bardman ..... PSU 11/15/10 11/13/10 18,000 36,000 72,000 — 1,002,600
RSU 11/15/10 11/13/10 — — — 24,000 487,200
FY11 Bonus N/A N/A 220,500 315,000 630,000 331,000
Guerrino De Luca . . PSU 11/15/10 11/13/10 15,000 30,000 60,000 — 835,500
FY11 Bonus N/A N/A 385,000 550,000 1,100,000 578,000
Werner Heid . . . . . . PSU 11/15/10 11/13/10 18,000 36,000 72,000 — 1,002,600
RSU 11/15/10 11/13/10 — — — 24,000 487,200
FY11 Bonus N/A N/A 299,250 427,500 855,000 415,000
Junien Labrousse . . PSU 11/15/10 11/13/10 18,000 36,000 72,000 — 1,002,600
RSU 11/15/10 11/13/10 — — — 24,000 487,200
FY11 Bonus N/A N/A 363,759 519,655 1,039,310 535,276
(1) The amounts in these columns reflect possible payouts with respect to each applicable performance period for
the FY11 bonus programs under the Bonus Plan.
(2) The amounts in this column reflect actual payouts with respect to each applicable performance period for
the FY11 bonus programs under the Bonus Plan. The actual payout amounts are reflected in the Non-Equity
Incentive Plan Compensation column of the Summary Compensation Table for FY11.
(3) Represents PSUs. All shares subject to the PSUs are unvested. The actual amount, if any, of shares that will
vest under the PSUs will not be known until the end of the performance period on November 15, 2013.
(4) Represents RSUs that vest at a rate of 25% per year over four years, on each yearly anniversary of the grant
date.
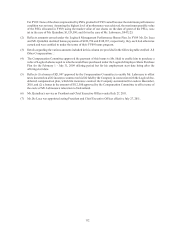
(5) These amounts do not represent the actual economic value realized by the named executive officer. Amounts
in this column represent the grant date fair value of PSUs and RSUs calculated in accordance with ASC 718
but does not include a reduction for forfeitures. For PSUs, that number is calculated by multiplying the value
determined using the Monte Carlo method by the target number of units awarded. For RSUs, that number
is equal to the closing price of Logitech shares on the grant date. The key assumptions for the valuation of
the PSUs are presented in Note 12 to the Consolidated Financial Statements included in Logitech’s Annual
Report to Shareholders and Annual Report on Form 10-K for FY11 filed with the SEC on May 27, 2011.