Logitech 2011 Annual Report Download - page 110
Download and view the complete annual report
Please find page 110 of the 2011 Logitech annual report below. You can navigate through the pages in the report by either clicking on the pages listed below, or by using the keyword search tool below to find specific information within the annual report.-
 1
1 -
2
-
3
-
4
-
5
-
6
-
7
-
8
-
9
-
10
-
11
-
12
-
13
-
14
-
15
-
16
-
17
-
18
-
19
-
20
-
21
-
22
-
23
-
24
-
25
-
26
-
27
-
28
-
29
-
30
-
31
-
32
-
33
-
34
-
35
-
36
-
37
-
38
-
39
-
40
-
41
-
42
-
43
-
44
-
45
-
46
-
47
-
48
-
49
-
50
-
51
-
52
-
53
-
54
-
55
-
56
-
57
-
58
-
59
-
60
-
61
-
62
-
63
-
64
-
65
-
66
-
67
-
68
-
69
-
70
-
71
-
72
-
73
-
74
-
75
-
76
-
77
-
78
-
79
-
80
-
81
-
82
-
83
-
84
-
85
-
86
-
87
-
88
-
89
-
90
-
91
-
92
-
93
-
94
-
95
-
96
-
97
-
98
-
99
-
 100
100 -
 101
101 -
 102
102 -
 103
103 -
 104
104 -
 105
105 -
 106
106 -
 107
107 -
 108
108 -
 109
109 -
 110
110 -
 111
111 -
 112
112 -
 113
113 -
 114
114 -
 115
115 -
 116
116 -
 117
117 -
 118
118 -
 119
119 -
 120
120 -
121
-
122
-
123
-
124
-
125
-
126
-
127
-
128
-
129
-
130
-
131
-
132
-
133
-
134
-
135
-
136
-
137
-
138
-
139
-
140
-
141
-
142
-
143
-
144
-
145
-
146
-
147
-
148
-
149
-
150
-
151
-
152
-
153
-
154
-
155
-
156
-
157
-
158
-
159
-
160
-
161
-
162
-
163
-
164
-
165
-
166
-
167
-
168
-
169
-
170
-
171
-
172
-
173
-
174
-
175
-
176
-
177
-
178
-
179
-
180
-
181
-
182
-
183
-
184
-
185
-
186
-
187
-
188
-
189
-
190
-
191
-
192
-
193
-
194
-
195
-
196
-
197
-
198
-
199
-
200
-
201
-
202
-
203
-
204
-
205
-
206
-
207
-
208
-
209
-
210
-
211
-
212
-
213
-
214
-
215
-
216
-
217
-
218
-
219
-
220
-
221
-
222
-
223
-
224
-
225
-
226
-
227
-
228
-
229
-
230
-
231
-
232
-
233
-
234
-
235
-
236
-
237
-
238
-
239
-
240
-
241
-
242
-
243
-
244
-
245
-
246
-
247
-
248
-
249
-
250
-
251
-
252
-
253
-
254
-
255
-
256
 |
 |

98
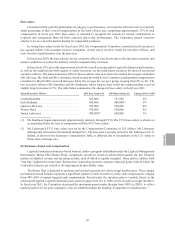
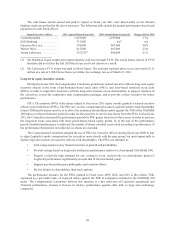
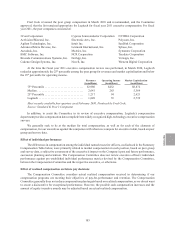
The cash bonus awards earned and paid in respect of fiscal year 2011 were based solely on the formula
funding results prescribed by the above measures. The following table details the annual performance-based cash
payments for each listed officer.
Named Executive Officer 2011 Annual Bonus Earned ($) 2010 Annual Bonus Earned ($) Change 2011 to 2010
Gerald Quindlen ............ 1,083,000 1,299,000 -17%
Erik Bardman .............. 331,000 n/a
(1) n/a
Guerrino De Luca ........... 578,000 907,000 -36%
Werner Heid . . . . . . . . . . . . . . . 415,000 607,000 -32%
Junien Labrousse . . . . . . . . . . . 535,276
(2) 680,000 -21%
(1) Mr. Bardman began employment approximately mid-way through FY10. His actual bonus earned in FY10
therefore did not reflect the full 2010 fiscal year and is not shown as a result.
(2) Mr. Labrousse’s FY11 bonus was paid in Swiss francs. The amounts reported above were converted to U.S.
dollars at a rate of 1.0924 Swiss francs per dollar, the exchange rate as of March 31, 2011.
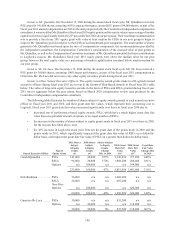
Long-term equity incentive awards
During fiscal year 2011 the Compensation Committee granted our named executive officers long-term equity
incentive awards in the form of performance-based stock units (PSUs), and time-based restricted stock units
(RSUs) in order to align their incentives with the long-term interests of our shareholders, to support retention of
the executives, to provide competitive total compensation packages, and to provide a direct incentive for future
performance.
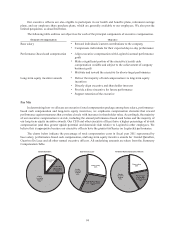
PSUs. The majority (60%) of the shares subject to fiscal year 2011 equity awards granted to named executive
officers were in the form of PSUs. The PSUs are “at-risk” compensation because Logitech’s relative total shareholder
return (TSR) performance must be at or above the minimum threshold percentile against the TSR of the NASDAQ
100 index over the performance period in order for the executive to receive any shares from the PSUs. In fiscal year
2011, the Committee increased the performance period for PSU grants from two to three years in order to increase
the long-term focus associated with these performance-based equity grants. If, at the end of the performance
period, threshold performance is achieved, the number of shares awarded is pro-rated according to performance. If
the performance threshold is not achieved, no shares are awarded.
The Compensation Committee adopted the use of PSUs for executive officers during fiscal year 2009 in part
to align Logitech’s equity compensation for executives more closely with the peer group, but most importantly to
further align the interests of executive officers with shareholders. The PSUs are intended to:
• Link compensation to key financial metrics of growth and profitability.
• Provide vesting based on Logitech’s stock price performance relative to a benchmark (NASDAQ 100).
• Require a relatively high standard for any vesting to occur, and provide an extraordinary payout if
Logitech’s performance significantly exceeds that of the benchmark group.
• Support pay-for-performance philosophy and retention efforts.
• Be less dilutive to shareholders than stock options.
The performance measure for the PSUs granted in fiscal years 2009, 2010, and 2011 is the relative TSR,
expressed as a percentile rank, of Logitech shares against the TSR of companies included in the NASDAQ 100
Index. The Compensation Committee believes this measure is a key reflection of Logitech’s operational and
financial performance, because it focuses on relative performance against other mid- to large-size technology
companies.