Logitech 2011 Annual Report Download - page 221
Download and view the complete annual report
Please find page 221 of the 2011 Logitech annual report below. You can navigate through the pages in the report by either clicking on the pages listed below, or by using the keyword search tool below to find specific information within the annual report.-
 1
1 -
2
-
3
-
4
-
5
-
6
-
7
-
8
-
9
-
10
-
11
-
12
-
13
-
14
-
15
-
16
-
17
-
18
-
19
-
20
-
21
-
22
-
23
-
24
-
25
-
26
-
27
-
28
-
29
-
30
-
31
-
32
-
33
-
34
-
35
-
36
-
37
-
38
-
39
-
40
-
41
-
42
-
43
-
44
-
45
-
46
-
47
-
48
-
49
-
50
-
51
-
52
-
53
-
54
-
55
-
56
-
57
-
58
-
59
-
60
-
61
-
62
-
63
-
64
-
65
-
66
-
67
-
68
-
69
-
70
-
71
-
72
-
73
-
74
-
75
-
76
-
77
-
78
-
79
-
80
-
81
-
82
-
83
-
84
-
85
-
86
-
87
-
88
-
89
-
90
-
91
-
92
-
93
-
94
-
95
-
96
-
97
-
98
-
99
-
100
-
101
-
102
-
103
-
104
-
105
-
106
-
107
-
108
-
109
-
110
-
111
-
112
-
113
-
114
-
115
-
116
-
117
-
118
-
119
-
120
-
121
-
122
-
123
-
124
-
125
-
126
-
127
-
128
-
129
-
130
-
131
-
132
-
133
-
134
-
135
-
136
-
137
-
138
-
139
-
140
-
141
-
142
-
143
-
144
-
145
-
146
-
147
-
148
-
149
-
150
-
151
-
152
-
153
-
154
-
155
-
156
-
157
-
158
-
159
-
160
-
161
-
162
-
163
-
164
-
165
-
166
-
167
-
168
-
169
-
170
-
171
-
172
-
173
-
174
-
175
-
176
-
177
-
178
-
179
-
180
-
181
-
182
-
183
-
184
-
185
-
186
-
187
-
188
-
189
-
190
-
191
-
192
-
193
-
194
-
195
-
196
-
197
-
198
-
199
-
200
-
201
-
202
-
203
-
204
-
205
-
206
-
207
-
208
-
209
-
210
-
 211
211 -
 212
212 -
 213
213 -
 214
214 -
 215
215 -
 216
216 -
 217
217 -
 218
218 -
 219
219 -
 220
220 -
 221
221 -
 222
222 -
 223
223 -
 224
224 -
 225
225 -
 226
226 -
 227
227 -
 228
228 -
 229
229 -
 230
230 -
 231
231 -
232
-
233
-
234
-
235
-
236
-
237
-
238
-
239
-
240
-
241
-
242
-
243
-
244
-
245
-
246
-
247
-
248
-
249
-
250
-
251
-
252
-
253
-
254
-
255
-
256
 |
 |

ANNUAl REPORT
209
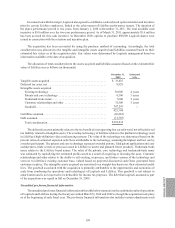
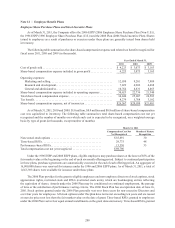
to non-executive board members under the 2006 Plan vest in one annual installment on the grant date anniversary.
Performance-based RSUS granted under the 2006 Plan vest at the end of the performance period upon meeting
certain share price performance criteria measured against market conditions. The performance period is three
years for performance-based RSU grants made in fiscal year 2011 and two years for performance-based RSU
grants made in fiscal years 2010 and 2009. An aggregate of 17,500,000 shares was reserved for issuance under the
2006 Plan. As of March 31, 2011, a total of 4,493,291 shares were available for issuance under this plan.
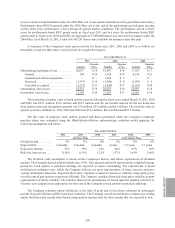
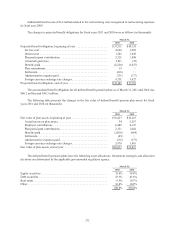
A summary of the Company’s stock option activity for fiscal years 2011, 2010 and 2009 is as follows (in
thousands, except per share data; exercise prices are weighted averages):
Year ended March 31,
2011 2010 2009
Number Exercise
Price Number Exercise
Price Number Exercise
Price
Outstanding, beginning of year.......... 20,037 $18 18,897 $18 17,952 $17
Granted.......................... 294 $16 3,520 $14 4,145 $21
Assumed in LifeSize acquisition ...... — $— 1,024 $ 5 — $—
Exercised ........................ (2,747) $10 (1,980) $ 8 (2,037) $ 9
Cancelled or expired................ (1,272) $21 (1,424) $17 (1,163) $24
Outstanding, end of year . . . . . . . . . . . . . . . 16,312 $19 20,037 $18 18,897 $18
Exercisable, end of year................ 11,205 $20 11,287 $17 10,981 $14
The total pretax intrinsic value of stock options exercised during the fiscal years ended March 31, 2011, 2010
and 2009 was $23.1 million, $15.0 million and $33.2 million and the tax benefit realized for the tax deduction
from options exercised during those periods was $7.6 million, $3.9 million and $8.5 million. The total fair value of
options vested as of March 31, 2011, 2010 and 2009 was $74.3 million, $66.4 million and $57.7 million.
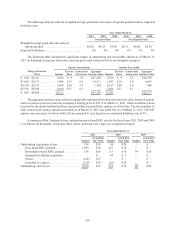
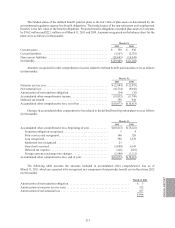
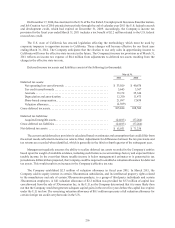
The fair value of employee stock options granted and shares purchased under the Company’s employee
purchase plans was estimated using the Black-Scholes-Merton option-pricing valuation model applying the
following assumptions and values:
Year ended March 31,
2011 2010 2009 2011 2010 2009
Purchase Plans Stock Option Plans
Dividend yield .......... 0% 0% 0% 0% 0% 0%
Expected life ........... 6 months 6 months 6 months 4 years 3.3 years 3.7 years
Expected volatility . . . . . . 35% 59% 63% 48% 47% 36%
Risk-free interest rate .... 0.16% 0.19% 1.23% 1.57% 1.64% 2.40%
The dividend yield assumption is based on the Company’s history and future expectations of dividend
payouts. The Company has not paid dividends since 1996. The expected option life represents the weighted-average
period the stock options or purchase offerings are expected to remain outstanding. The expected life is based
on historical settlement rates, which the Company believes are most representative of future exercise and post-
vesting termination behaviors. Expected share price volatility is based on historical volatility using daily prices
over the term of past options or purchase offerings. The Company considers historical share price volatility as most
representative of future volatility. The risk-free interest rate assumptions are based upon the implied yield of U.S.
Treasury zero-coupon issues appropriate for the term of the Company’s stock options or purchase offerings.
The Company estimates option forfeitures at the time of grant and revises those estimates in subsequent
periods if actual forfeitures differ from those estimates. The Company uses historical data to estimate pre-vesting
option forfeitures and records share-based compensation expense only for those awards that are expected to vest.