Logitech 2011 Annual Report Download - page 155
Download and view the complete annual report
Please find page 155 of the 2011 Logitech annual report below. You can navigate through the pages in the report by either clicking on the pages listed below, or by using the keyword search tool below to find specific information within the annual report.-
 1
1 -
2
-
3
-
4
-
5
-
6
-
7
-
8
-
9
-
10
-
11
-
12
-
13
-
14
-
15
-
16
-
17
-
18
-
19
-
20
-
21
-
22
-
23
-
24
-
25
-
26
-
27
-
28
-
29
-
30
-
31
-
32
-
33
-
34
-
35
-
36
-
37
-
38
-
39
-
40
-
41
-
42
-
43
-
44
-
45
-
46
-
47
-
48
-
49
-
50
-
51
-
52
-
53
-
54
-
55
-
56
-
57
-
58
-
59
-
60
-
61
-
62
-
63
-
64
-
65
-
66
-
67
-
68
-
69
-
70
-
71
-
72
-
73
-
74
-
75
-
76
-
77
-
78
-
79
-
80
-
81
-
82
-
83
-
84
-
85
-
86
-
87
-
88
-
89
-
90
-
91
-
92
-
93
-
94
-
95
-
96
-
97
-
98
-
99
-
100
-
101
-
102
-
103
-
104
-
105
-
106
-
107
-
108
-
109
-
110
-
111
-
112
-
113
-
114
-
115
-
116
-
117
-
118
-
119
-
120
-
121
-
122
-
123
-
124
-
125
-
126
-
127
-
128
-
129
-
130
-
131
-
132
-
133
-
134
-
135
-
136
-
137
-
138
-
139
-
140
-
141
-
142
-
143
-
144
-
 145
145 -
 146
146 -
 147
147 -
 148
148 -
 149
149 -
 150
150 -
 151
151 -
 152
152 -
 153
153 -
 154
154 -
 155
155 -
 156
156 -
 157
157 -
 158
158 -
 159
159 -
 160
160 -
 161
161 -
 162
162 -
 163
163 -
 164
164 -
 165
165 -
166
-
167
-
168
-
169
-
170
-
171
-
172
-
173
-
174
-
175
-
176
-
177
-
178
-
179
-
180
-
181
-
182
-
183
-
184
-
185
-
186
-
187
-
188
-
189
-
190
-
191
-
192
-
193
-
194
-
195
-
196
-
197
-
198
-
199
-
200
-
201
-
202
-
203
-
204
-
205
-
206
-
207
-
208
-
209
-
210
-
211
-
212
-
213
-
214
-
215
-
216
-
217
-
218
-
219
-
220
-
221
-
222
-
223
-
224
-
225
-
226
-
227
-
228
-
229
-
230
-
231
-
232
-
233
-
234
-
235
-
236
-
237
-
238
-
239
-
240
-
241
-
242
-
243
-
244
-
245
-
246
-
247
-
248
-
249
-
250
-
251
-
252
-
253
-
254
-
255
-
256
 |
 |

ANNUAl REPORT
143
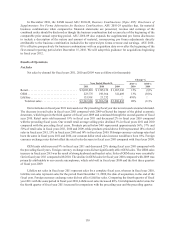
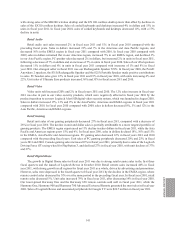
The increase in operating expenses as a percentage of net sales was primarily due to the addition of LifeSize
expenses beginning in December 2009, increased advertising and marketing expenses related to promotional
campaigns for Harmony and Logitech Revue, and increased investment in areas which we believe represent future
growth opportunities. Fiscal year 2010 included $6.6 million in transactions costs related to the acquisition of
LifeSize and $1.8 million in restructuring charges associated with the restructuring plan initiated in January 2009.
We plan to continue implementing efficiencies in our current operations that are intended to limit future growth
in operating expenses below the growth rate in revenues, by restraining or reducing non-critical expenses while
investing in activities that will sustain and drive revenue growth.
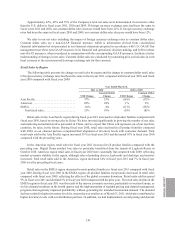
We refer to our operating expenses excluding the impact of foreign currency exchange rates as constant
dollar operating expenses. Constant dollar operating expenses are a non-GAAP financial measure, which is
information derived from consolidated financial information but not presented in our financial statements prepared
in accordance with U.S. GAAP. Our management uses these non-GAAP measures in its financial and operational
decision-making, and believes these non-GAAP measures, when considered in conjunction with the corresponding
GAAP measures, facilitate a better understanding of changes in operating expenses. Constant dollar operating
expenses are calculated by translating prior period operating expenses in each local currency at the current period’s
average exchange rate for that currency.
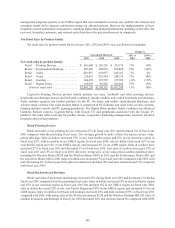
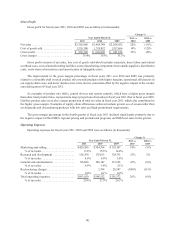
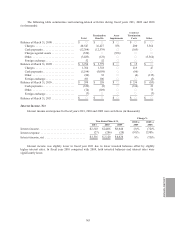
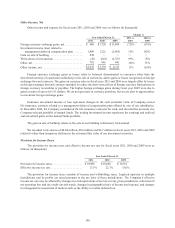
Marketing and Selling
Marketing and selling expense consists of personnel and related overhead costs, corporate and product
marketing, promotions, advertising, trade shows, customer and technical support and facilities costs.
Marketing and selling expenses increased in fiscal year 2011 compared with fiscal year 2010 due to the
addition of LifeSize sales and marketing personnel in December 2009, variable demand generation activities,
and increased personnel costs. In fiscal year 2011, we invested approximately $32 million in variable demand
generation activities focused on Harmony remotes and Logitech Revue. Non-Lifesize personnel costs grew due to a
14% increase in headcount to support the return to sales growth and expansion of sales efforts in China, and normal
salary and bonus increases related to our improved profitability compared with the preceding fiscal year.
The decline in marketing and selling expenses in fiscal year 2010 compared with fiscal year 2009 resulted
primarily from lower spending in marketing development funds, travel expenses and consulting fees. Personnel
costs increased in fiscal year 2010 over the preceding fiscal year partially due to the addition of LifeSize sales and
marketing personnel, and partially relating to a comparative fiscal year in which discretionary personnel costs were
reduced due to the economic downturn. Bad debt expense declined significantly in fiscal year 2010 as economic
conditions stabilized, compared with fiscal year 2009, when customers were experiencing increased financial
difficulties related to the economic downturn.
Foreign currency exchange rates had no impact on marketing and selling expenses for fiscal years 2011 and
2010. The percentage changes in constant dollar marketing and selling expenses for fiscal years 2011 and 2010
compared with the preceding years would be the same as the percentage changes in U.S. dollars.
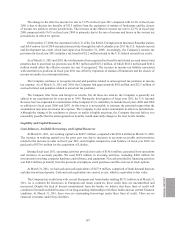
Research and Development
Research and development expense consists of personnel and related overhead costs, contractors and outside
consultants, supplies and materials, equipment depreciation and facilities costs, all associated with the design and
development of new products and enhancements of existing products.
The increase in research and development expense for fiscal year 2011 compared with 2010 was due to the
addition of LifeSize personnel and expenses. Research and development expenses in our peripherals business
remained largely flat year over year, as expenditures were re-aligned from mature product lines and multiple
similar products to product lines with expected future growth potential.