Logitech 2011 Annual Report Download - page 144
Download and view the complete annual report
Please find page 144 of the 2011 Logitech annual report below. You can navigate through the pages in the report by either clicking on the pages listed below, or by using the keyword search tool below to find specific information within the annual report.-
 1
1 -
2
-
3
-
4
-
5
-
6
-
7
-
8
-
9
-
10
-
11
-
12
-
13
-
14
-
15
-
16
-
17
-
18
-
19
-
20
-
21
-
22
-
23
-
24
-
25
-
26
-
27
-
28
-
29
-
30
-
31
-
32
-
33
-
34
-
35
-
36
-
37
-
38
-
39
-
40
-
41
-
42
-
43
-
44
-
45
-
46
-
47
-
48
-
49
-
50
-
51
-
52
-
53
-
54
-
55
-
56
-
57
-
58
-
59
-
60
-
61
-
62
-
63
-
64
-
65
-
66
-
67
-
68
-
69
-
70
-
71
-
72
-
73
-
74
-
75
-
76
-
77
-
78
-
79
-
80
-
81
-
82
-
83
-
84
-
85
-
86
-
87
-
88
-
89
-
90
-
91
-
92
-
93
-
94
-
95
-
96
-
97
-
98
-
99
-
100
-
101
-
102
-
103
-
104
-
105
-
106
-
107
-
108
-
109
-
110
-
111
-
112
-
113
-
114
-
115
-
116
-
117
-
118
-
119
-
120
-
121
-
122
-
123
-
124
-
125
-
126
-
127
-
128
-
129
-
130
-
131
-
132
-
133
-
 134
134 -
 135
135 -
 136
136 -
 137
137 -
 138
138 -
 139
139 -
 140
140 -
 141
141 -
 142
142 -
 143
143 -
 144
144 -
 145
145 -
 146
146 -
 147
147 -
 148
148 -
 149
149 -
 150
150 -
 151
151 -
 152
152 -
 153
153 -
 154
154 -
155
-
156
-
157
-
158
-
159
-
160
-
161
-
162
-
163
-
164
-
165
-
166
-
167
-
168
-
169
-
170
-
171
-
172
-
173
-
174
-
175
-
176
-
177
-
178
-
179
-
180
-
181
-
182
-
183
-
184
-
185
-
186
-
187
-
188
-
189
-
190
-
191
-
192
-
193
-
194
-
195
-
196
-
197
-
198
-
199
-
200
-
201
-
202
-
203
-
204
-
205
-
206
-
207
-
208
-
209
-
210
-
211
-
212
-
213
-
214
-
215
-
216
-
217
-
218
-
219
-
220
-
221
-
222
-
223
-
224
-
225
-
226
-
227
-
228
-
229
-
230
-
231
-
232
-
233
-
234
-
235
-
236
-
237
-
238
-
239
-
240
-
241
-
242
-
243
-
244
-
245
-
246
-
247
-
248
-
249
-
250
-
251
-
252
-
253
-
254
-
255
-
256
 |
 |
132
sales, in the future. Emerging markets include potentially high economic growth, offset by potentially entrenched
local competition, higher credit risks, and cultural differences that affect consumer trends in ways which may be
substantially different from our current major markets.
For the fiscal year ended March 31, 2011, our video conferencing segment represented 6% of our net sales, and
we expect sales from the LifeSize division to grow faster than our overall sales. Our LifeSize division will require
significant continuing investments in product development and sales and marketing to stimulate and support
future growth.
In October 2010, we introduced our Logitech Revue and related peripherals for the Google TV platform in the
United States. Logitech Revue is a companion box for Google TV software that incorporates Logitech’s Harmony
remote control technology and enables Google TV software to bring together the Internet and the television. We
have invested and expect to continue to invest significant funds in the further development of products for the
Google TV platform and other TV-related peripherals. To date the Google TV platform has not met widespread
consumer acceptance and our sales of Logitech Revue and related products have been below our expectations.
However, we believe that the continued enhancement of the features and functionality of the Google TV platform
over time will lead to greater consumer acceptance, and our development of additional home-entertainment and
TV-related peripherals will provide us with incremental sales over an extended period of time.
Sales of our OEM mice and keyboards have historically made up the bulk of our OEM sales. OEM sales
accounted for 9% and 10% of total revenues during the fiscal years ended March 31, 2011 and 2010. In recent years,
the shift away from desktop PCs adversely affected our sales of OEM mice and keyboards, which are sold with
name-brand desktop PCs. We expect this trend to continue and for OEM sales to comprise a smaller percentage of
our total revenues in the future.
We continue to evaluate potential acquisitions to enhance the breadth and depth of our expertise in engineering
and other functional areas, our technologies and our product offerings.
Most of our revenue comes from sales to our retail channels, which resell to consumers, retailers and
distributors. As a result, our customers’ demand for our products depends in substantial part on trends in consumer
confidence and consumer spending, as well as the levels of inventory which our customers, and their customers,
choose to maintain. We use sell-through data, which represents sales of our products by our retailer customers to
consumers, and by our distributor customers to their customers, along with other metrics to indicate consumer
demand for our products. Sell through data is subject to limitations due to collection methods and the third party
nature of the data and thus may not be an entirely accurate indicator of actual consumer demand for our products.
In addition, the customers supplying sell through data vary by geographic region and from period to period, but
typically represent a majority of our retail sales.
Although our financial results are reported in U.S. dollars, approximately 42% of our sales for the fiscal year
ended March 31, 2011 were made in currencies other than the U.S. dollar, such as the euro, Chinese renminbi,
Canadian dollar and Japanese yen. Our product costs are primarily in U.S. dollars and Chinese renminbi. Our
operating expenses are incurred in U.S. dollars, Chinese renminbi, euros, Swiss francs and, to a lesser extent,
28 other currencies. To the extent that the U.S. dollar significantly increases or decreases in value relative to the
currencies in which our sales and operating expenses are denominated, the reported dollar amounts of our sales
and expenses may decrease or increase. In fiscal year 2011 the impact of foreign currency exchange rates on our
operating income was not material.
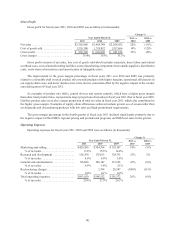
Our gross margins vary with the mix of products sold, competitive activity, product life cycle, new product
introductions, unit volumes, commodity and supply chain costs, foreign currency exchange rate fluctuations,
geographic sales mix, and the complexity and functionality of new product introductions. Changes in consumer
demand affect the need for us to undertake promotional efforts, such as cooperative marketing arrangements,
customer incentive programs or other pricing programs, which alter our product gross margins. Gross margins for