Logitech 2011 Annual Report Download - page 226
Download and view the complete annual report
Please find page 226 of the 2011 Logitech annual report below. You can navigate through the pages in the report by either clicking on the pages listed below, or by using the keyword search tool below to find specific information within the annual report.-
 1
1 -
2
-
3
-
4
-
5
-
6
-
7
-
8
-
9
-
10
-
11
-
12
-
13
-
14
-
15
-
16
-
17
-
18
-
19
-
20
-
21
-
22
-
23
-
24
-
25
-
26
-
27
-
28
-
29
-
30
-
31
-
32
-
33
-
34
-
35
-
36
-
37
-
38
-
39
-
40
-
41
-
42
-
43
-
44
-
45
-
46
-
47
-
48
-
49
-
50
-
51
-
52
-
53
-
54
-
55
-
56
-
57
-
58
-
59
-
60
-
61
-
62
-
63
-
64
-
65
-
66
-
67
-
68
-
69
-
70
-
71
-
72
-
73
-
74
-
75
-
76
-
77
-
78
-
79
-
80
-
81
-
82
-
83
-
84
-
85
-
86
-
87
-
88
-
89
-
90
-
91
-
92
-
93
-
94
-
95
-
96
-
97
-
98
-
99
-
100
-
101
-
102
-
103
-
104
-
105
-
106
-
107
-
108
-
109
-
110
-
111
-
112
-
113
-
114
-
115
-
116
-
117
-
118
-
119
-
120
-
121
-
122
-
123
-
124
-
125
-
126
-
127
-
128
-
129
-
130
-
131
-
132
-
133
-
134
-
135
-
136
-
137
-
138
-
139
-
140
-
141
-
142
-
143
-
144
-
145
-
146
-
147
-
148
-
149
-
150
-
151
-
152
-
153
-
154
-
155
-
156
-
157
-
158
-
159
-
160
-
161
-
162
-
163
-
164
-
165
-
166
-
167
-
168
-
169
-
170
-
171
-
172
-
173
-
174
-
175
-
176
-
177
-
178
-
179
-
180
-
181
-
182
-
183
-
184
-
185
-
186
-
187
-
188
-
189
-
190
-
191
-
192
-
193
-
194
-
195
-
196
-
197
-
198
-
199
-
200
-
201
-
202
-
203
-
204
-
205
-
206
-
207
-
208
-
209
-
210
-
211
-
212
-
213
-
214
-
215
-
 216
216 -
 217
217 -
 218
218 -
 219
219 -
 220
220 -
 221
221 -
 222
222 -
 223
223 -
 224
224 -
 225
225 -
 226
226 -
 227
227 -
 228
228 -
 229
229 -
 230
230 -
 231
231 -
 232
232 -
 233
233 -
 234
234 -
 235
235 -
 236
236 -
237
-
238
-
239
-
240
-
241
-
242
-
243
-
244
-
245
-
246
-
247
-
248
-
249
-
250
-
251
-
252
-
253
-
254
-
255
-
256
 |
 |

214
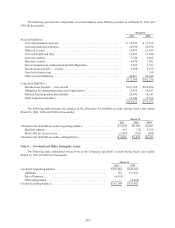
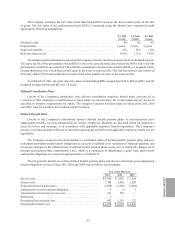
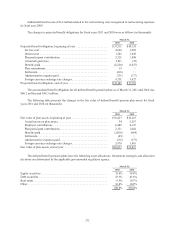
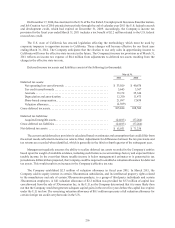
The Company reassesses its benefit plan assumptions on a regular basis. The actuarial assumptions for the
pension plans for fiscal years 2011 and 2010 were as follows:
2011 2010
Benefit Obligation Periodic Cost Benefit Obligation Periodic Cost
Discount rate .................... 2.00% to 3.75% 2.00% to 3.75% 2.00% to 3.25% 2.00% to 3.00%
Estimated rate of
compensation increase . . . . . . . . . 3.00% to 5.00% 2.50% to 5.00% 2.50% to 5.00% 2.50% to 5.00%
Expected average rate of
return on plan assets ........... 1.00% to 4.00% 1.00% to 4.75% 1.00% to 4.75% 1.00% to 4.25%
The discount rate is estimated based on corporate bond yields or securities of similar quality in the respective
country, with a duration approximating the period over which the benefit obligations are expected to be paid. The
Company bases the compensation increase assumptions on historical experience and future expectations. The
expected average rate of return for the Company’s defined benefit pension plans represents the average rate of
return expected to be earned on plan assets over the period that the benefit obligations are expected to be paid,
based on government bond notes in the respective country, adjusted for corporate risk premiums as appropriate.
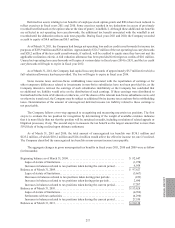
The following table reflects the benefit payments that the Company expects the plans to pay in the periods
noted (in thousands):
Year ending March 31,
2012 ....................................................... $3,898
2013 ....................................................... 4,024
2014 ....................................................... 4,058
2015 ....................................................... 4,018
2016 ....................................................... 4,217
Thereafter................................................... 19,360
$39,575
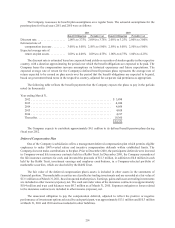
The Company expects to contribute approximately $4.1 million to its defined benefit pension plans during
fiscal year 2012.
Deferred Compensation Plan
One of the Company’s subsidiaries offers a management deferred compensation plan which permits eligible
employees to make 100%-vested salary and incentive compensation deferrals within established limits. The
Company does not make contributions to the plan. Prior to December 2010, the participants’ deferrals were invested
in Company-owned life insurance contracts held in a Rabbi Trust. In December 2010, the Company surrendered
the life insurance contracts for cash, and invested the proceeds of $11.3 million, in addition to $0.8 million in cash
held by the Rabbi Trust, investment earnings and employee contributions, in a Company-selected portfolio of
marketable securities, which are also held by the Rabbi Trust.
The fair value of the deferred compensation plan’s assets is included in other assets in the statements of
financial position. The marketable securities are classified as trading investments and are recorded at a fair value of
$13.1 million as of March 31, 2011, based on quoted market prices. Earnings, gains and losses on trading investments
are included in other income (expense), net. The cash surrender value of the insurance contracts was approximately
$10.4 million and trust cash balances were $0.7 million as of March 31, 2010. Expenses and gains or losses related
to the insurance contracts are included in other income (expense), net.
The unsecured obligation to pay the compensation deferred, adjusted to reflect the positive or negative
performance of investment options selected by each participant, was approximately $13.1 million and $10.3 million
at March 31, 2011 and 2010 and was included in other liabilities.