Xerox 2003 Annual Report Download - page 89
Download and view the complete annual report
Please find page 89 of the 2003 Xerox annual report below. You can navigate through the pages in the report by either clicking on the pages listed below, or by using the keyword search tool below to find specific information within the annual report.-
 1
1 -
2
-
3
-
4
-
5
-
6
-
7
-
8
-
9
-
10
-
11
-
12
-
13
-
14
-
15
-
16
-
17
-
18
-
19
-
20
-
21
-
22
-
23
-
24
-
25
-
26
-
27
-
28
-
29
-
30
-
31
-
32
-
33
-
34
-
35
-
36
-
37
-
38
-
39
-
40
-
41
-
42
-
43
-
44
-
45
-
46
-
47
-
48
-
49
-
50
-
51
-
52
-
53
-
54
-
55
-
56
-
57
-
58
-
59
-
60
-
61
-
62
-
63
-
64
-
65
-
66
-
67
-
68
-
69
-
70
-
71
-
72
-
73
-
74
-
75
-
76
-
77
-
78
-
 79
79 -
 80
80 -
 81
81 -
 82
82 -
 83
83 -
 84
84 -
 85
85 -
 86
86 -
 87
87 -
 88
88 -
 89
89 -
 90
90 -
 91
91 -
 92
92 -
 93
93 -
 94
94 -
 95
95 -
 96
96 -
 97
97 -
 98
98 -
 99
99 -
100
 |
 |

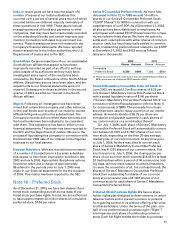
87
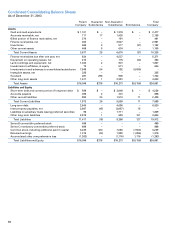
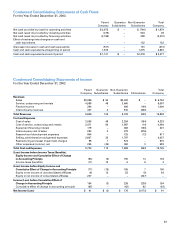
Condensed Consolidating Statements of Cash Flows
For the Year Ended December 31, 2003
Parent Guarantor Non-Guarantor Total
Company Subsidiaries Subsidiaries Company
Net cash provided by (used in) operating activities $ 2,673 $ – $ (794) $ 1,879
Net cash (used in) provided by investing activities (475) – 524 49
Net cash (used in) provided by financing activities (2,769) – 299 (2,470)
Effect of exchange rate changes on cash and
cash equivalents – – 132 132
(Decrease) increase in cash and cash equivalents (571) – 161 (410)
Cash and cash equivalents at beginning of period 1,672 – 1,215 2,887
Cash and cash equivalents at end of period $ 1,101 $ – $1,376 $ 2,477
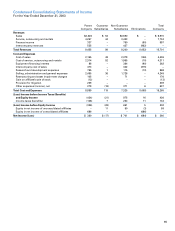
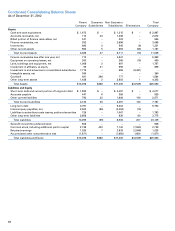
Condensed Consolidating Statements of Income
For the Year Ended December 31, 2002
Parent Guarantor Non-Guarantor Total
Company Subsidiaries Subsidiaries Eliminations Company
Revenues
Sales $3,396 $ 54 $3,302 $ – $ 6,752
Service, outsourcing and rentals 4,589 48 3,460 – 8,097
Finance income 294 – 806 (100) 1,000
Intercompany revenues 327 3 510 (840) –
Total Revenues 8,606 105 8,078 (940) 15,849
Cost and Expenses
Cost of sales 2,055 48 2,284 (154) 4,233
Cost of service, outsourcing and rentals 2,471 50 1,987 (14) 4,494
Equipment financing interest 119 – 382 (100) 401
Intercompany cost of sales 294 3 379 (676) –
Research and development expenses 804 – 125 (12) 917
Selling, administrative and general expenses 2,607 33 1,797 – 4,437
Restructuring and asset impairment charges 95 1 574 – 670
Other expenses (income), net 255 (25) 360 3 593
Total Cost and Expenses 8,700 110 7,888 (953) 15,745
(Loss) Income before Income Taxes (Benefits),
Equity Income and Cumulative Effect of Change
in Accounting Principle (94) (5) 190 13 104
Income taxes (benefits) (17) 10 5 6 4
(Loss) Income before Equity Income and
Cumulative Effect of Change in Accounting Principle (77) (15) 185 7 100
Equity in net income of unconsolidated affiliates (6) 12 53 (5) 54
Equity in net income of consolidated affiliates 237 – – (237) –
Income (Loss) before Cumulative Effect of
Change in Accounting Principle 154 (3) 238 (235) 154
Cumulative effect of change in accounting principle (63) – (62) 62 (63)
Net Income (Loss) $ 91 $ (3) $ 176 $(173) $ 91