Xerox 2003 Annual Report Download - page 87
Download and view the complete annual report
Please find page 87 of the 2003 Xerox annual report below. You can navigate through the pages in the report by either clicking on the pages listed below, or by using the keyword search tool below to find specific information within the annual report.-
 1
1 -
2
-
3
-
4
-
5
-
6
-
7
-
8
-
9
-
10
-
11
-
12
-
13
-
14
-
15
-
16
-
17
-
18
-
19
-
20
-
21
-
22
-
23
-
24
-
25
-
26
-
27
-
28
-
29
-
30
-
31
-
32
-
33
-
34
-
35
-
36
-
37
-
38
-
39
-
40
-
41
-
42
-
43
-
44
-
45
-
46
-
47
-
48
-
49
-
50
-
51
-
52
-
53
-
54
-
55
-
56
-
57
-
58
-
59
-
60
-
61
-
62
-
63
-
64
-
65
-
66
-
67
-
68
-
69
-
70
-
71
-
72
-
73
-
74
-
75
-
76
-
 77
77 -
 78
78 -
 79
79 -
 80
80 -
 81
81 -
 82
82 -
 83
83 -
 84
84 -
 85
85 -
 86
86 -
 87
87 -
 88
88 -
 89
89 -
 90
90 -
 91
91 -
 92
92 -
 93
93 -
 94
94 -
 95
95 -
 96
96 -
 97
97 -
98
-
99
-
100
 |
 |

85
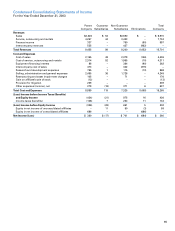
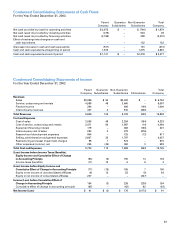
Condensed Consolidating Statements of Income
For the Year Ended December 31, 2003
Parent Guarantor Non-Guarantor Total
Company Subsidiaries Subsidiaries Eliminations Company
Revenues
Sales $3,326 $ 54 $3,590 $ – $ 6,970
Service, outsourcing and rentals 4,257 44 3,433 – 7,734
Finance income 337 – 750 (90) 997
Intercompany revenues 535 – 427 (962) –
Total Revenues 8,455 98 8,200 (1,052) 15,701
Cost and Expenses
Cost of sales 2,155 48 2,379 (146) 4,436
Cost of service, outsourcing and rentals 2,314 52 1,955 (10) 4,311
Equipment financing interest 88 – 364 (90) 362
Intercompany cost of sales 473 – 342 (815) –
Research and development expenses 765 1 115 (13) 868
Selling, administrative and general expenses 2,485 36 1,728 – 4,249
Restructuring and asset impairment charges 105 – 71 – 176
Gain on affiliate’s sale of stock (13) – – – (13)
Provision for litigation 239 – – – 239
Other expenses (income), net 278 (18) 371 6 637
Total Cost and Expenses 8,889 119 7,325 (1,068) 15,265
(Loss) Income before Income Taxes (Benefits)
and Equity Income (434) (21) 875 16 436
Income taxes (benefits) (108) 7 224 11 134
(Loss) Income before Equity Income (326) (28) 651 5 302
Equity in net income of unconsolidated affiliates – 11 50 (3) 58
Equity in net income of consolidated affiliates 686 – – (686) –
Net Income (Loss) $ 360 $ (17) $ 701 $ (684) $ 360