Xerox 2003 Annual Report Download - page 30
Download and view the complete annual report
Please find page 30 of the 2003 Xerox annual report below. You can navigate through the pages in the report by either clicking on the pages listed below, or by using the keyword search tool below to find specific information within the annual report.-
 1
1 -
2
-
3
-
4
-
5
-
6
-
7
-
8
-
9
-
10
-
11
-
12
-
13
-
14
-
15
-
16
-
17
-
18
-
19
-
 20
20 -
 21
21 -
 22
22 -
 23
23 -
 24
24 -
 25
25 -
 26
26 -
 27
27 -
 28
28 -
 29
29 -
 30
30 -
 31
31 -
 32
32 -
 33
33 -
 34
34 -
 35
35 -
 36
36 -
 37
37 -
 38
38 -
 39
39 -
 40
40 -
41
-
42
-
43
-
44
-
45
-
46
-
47
-
48
-
49
-
50
-
51
-
52
-
53
-
54
-
55
-
56
-
57
-
58
-
59
-
60
-
61
-
62
-
63
-
64
-
65
-
66
-
67
-
68
-
69
-
70
-
71
-
72
-
73
-
74
-
75
-
76
-
77
-
78
-
79
-
80
-
81
-
82
-
83
-
84
-
85
-
86
-
87
-
88
-
89
-
90
-
91
-
92
-
93
-
94
-
95
-
96
-
97
-
98
-
99
-
100
 |
 |

28
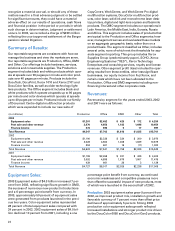
2003 SAG expense of $4.2 billion declined $188
million from 2002 including adverse currency impacts
of $172 million and $70 million of higher pension and
other employee benefit costs. 2003 SAG reductions
reflect improved productivity and employment reduc-
tions associated with our cost base restructuring,
lower bad debt expenses of $109 million and the
absence of 2002 expenses discussed below.
2002 SAG expense of $4.4 billion declined
$291 million from 2001. The reduction includes lower
bad debt expenses of $106 million, lower SOHO
spending of $84 million and a $34 million favorable
property tax adjustment in North America. These
decreases were partially offset by $106 million of inter-
nal-use software impairment charges, $65 million of
higher advertising and marketing communications
spending, $18 million of increased professional fees
and $26 million of losses associated with the exit from
certain leased facilities. The balance of the reduction
primarily reflects employment reductions associated
with our cost base restructuring actions.
Bad debt expense included in SAG was $224 mil-
lion, $332 million and $438 million in 2003, 2002 and
2001, respectively. The 2003 reduction reflects
improved collections performance, receivables aging
and write-off trends. Lower expense in 2002 is due to
improved customer administration, collection prac-
tices and credit approval policies, as well as our rev-
enue declines. Bad debt expense as a percent of total
revenue was 1.4 percent, 2.1 percent and 2.6 percent
for 2003, 2002 and 2001, respectively.
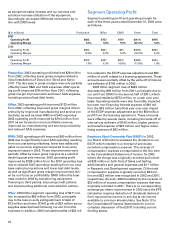
Restructuring Programs: For the three years ended
December 31, 2003, we have engaged in a series of
restructuring programs, resulting in approximately
$1.6 billion in charges related to downsizing our
employee base, exiting certain businesses, outsourcing
some internal functions and engaging in other actions
designed to reduce our cost structure. In 2003, we
recorded restructuring and asset impairment charges of
$176 million, primarily consisting of new severance
actions and pension settlements related to previous
employee restructuring actions. We expect prospective
annual savings associated with 2003 actions to be
approximately $170 million, as compared to 2003 levels.
Restructuring and asset impairment charges of $670
million and $715 million in 2002 and 2001, respectively,
primarily relate to severance and employee benefits
related to worldwide terminations as well as certain
costs related to the consolidation of excess facilities. The
remaining restructuring reserve balance at December
31, 2003 for all programs was $221 million. Charges
related to previous employee restructuring actions of
approximately $20 million are expected to be recorded
in 2004, primarily related to pension settlements.
Worldwide employment declined by approximately
6,700 in 2003, to approximately 61,100, primarily reflect-
ing reductions as part of our restructuring programs.
Worldwide employment was approximately 67,800 and
78,900 at December 31, 2002 and 2001, respectively.
Gain on Affiliate’s Sale of Stock: In 2003, we recorded
cumulative gains on an affiliate’s sale of stock of
$13 million reflecting our proportionate share of the
increase in equity of ScanSoft Inc., an equity invest-
ment. The gain resulted from ScanSoft’s issuance of
stock in connection with its acquisition of Speechworks,
Inc. ScanSoft is a developer of digital imaging soft-
ware that enables users to leverage the power of their
scanners, digital cameras and other electronic devices.
In 2001, the gain on affiliate’s sale of stock of $4 mil-
lion reflected our proportionate share of the increase
in equity of ScanSoft Inc., resulting from issuance of
their stock in connection with an acquisition.
Provision for Litigation: In 2003, we recorded a
$239 million provision for litigation relating to the
court approved settlement of the Berger v. Retirement
Income Guarantee Plan (RIGP) litigation which is dis-
cussed in more detail in Note 15 to the Consolidated
Financial Statements.
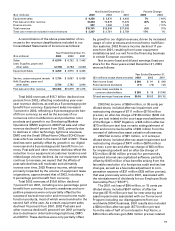
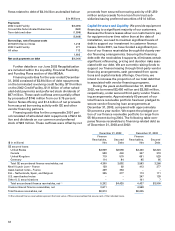
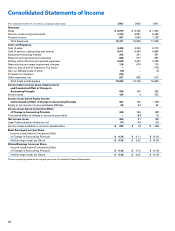
Other Expenses, Net: Other expenses, net for the three
years ended December 31, 2003 consisted of the fol-
lowing:
Year Ended December 31,
($ in millions) 2003 2002 2001
Non-financing interest expense $522 $495 $544
Interest income (65) (77) (101)
Net currency losses (gains) 11 77 (29)
Legal and regulatory matters 337 –
Amortization of goodwill (2001
only) and intangible assets 36 36 94
Loss (gain) on early
extinguishment of debt 73 (1) (63)
Business divestiture and asset
sale losses (gains) 13 (1) 10
Minorities’ interests in earnings
of subsidiaries 632
All other, net 38 24 53
$637 $593 $510
Non-financing interest expense: 2003 non-financing
interest expense was $27 million higher than 2002,
primarily reflecting 2003 net losses of $13 million
from the mark-to-market valuation of our interest rate
swaps compared to gains of $12 million in 2002. Due
to the inherent volatility in the interest rate markets,
we are unable to predict the amount of the above
noted mark-to-market gains or losses in future peri-
ods. 2003 non-financing interest expense included
higher interest rates and borrowing costs in the first
half of the year associated with the terms of the 2002
Credit Facility. These increased expenses were offset
by lower borrowing costs in the second half of 2003
following the June 2003 Recapitalization.