Xerox 2003 Annual Report Download - page 43
Download and view the complete annual report
Please find page 43 of the 2003 Xerox annual report below. You can navigate through the pages in the report by either clicking on the pages listed below, or by using the keyword search tool below to find specific information within the annual report.-
 1
1 -
2
-
3
-
4
-
5
-
6
-
7
-
8
-
9
-
10
-
11
-
12
-
13
-
14
-
15
-
16
-
17
-
18
-
19
-
20
-
21
-
22
-
23
-
24
-
25
-
26
-
27
-
28
-
29
-
30
-
31
-
32
-
 33
33 -
 34
34 -
 35
35 -
 36
36 -
 37
37 -
 38
38 -
 39
39 -
 40
40 -
 41
41 -
 42
42 -
 43
43 -
 44
44 -
 45
45 -
 46
46 -
 47
47 -
 48
48 -
 49
49 -
 50
50 -
 51
51 -
 52
52 -
 53
53 -
54
-
55
-
56
-
57
-
58
-
59
-
60
-
61
-
62
-
63
-
64
-
65
-
66
-
67
-
68
-
69
-
70
-
71
-
72
-
73
-
74
-
75
-
76
-
77
-
78
-
79
-
80
-
81
-
82
-
83
-
84
-
85
-
86
-
87
-
88
-
89
-
90
-
91
-
92
-
93
-
94
-
95
-
96
-
97
-
98
-
99
-
100
 |
 |

41
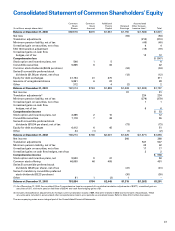
Consolidated Statement of Common Shareholders’ Equity
Common Common Additional Accumulated
Stock Stock Paid-In Retained Other Compre-
(In millions, except share data) Shares Amount Capital Earnings hensive Loss(1) Total
Balance at December 31, 2000 668,576 $670 $1,561 $1,150 $(1,580) $1,801
Net loss (94) (94)
Translation adjustments (210) (210)
Minimum pension liability, net of tax (40) (40)
Unrealized gain on securities, net of tax 44
FAS 133 transition adjustment (19) (19)
Unrealized gains on cash flow
hedges, net of tax 12 12
Comprehensive loss $ (347)
Stock option and incentive plans, net 546 1 5 6
Convertible securities 5,865 6 36 42
Common stock dividends ($0.05 per share) (34) (34)
Series B convertible preferred stock
dividends ($1.56 per share), net of tax (12) (12)
Equity for debt exchanges 41,154 41 270 311
Issuance of unregistered shares 5,861 6 22 28
Other 312 4 (2) 2
Balance at December 31, 2001 722,314 $724 $1,898 $1,008 $(1,833) $1,797
Net income 91 91
Translation adjustments(2) 234 234
Minimum pension liability, net of tax (279) (279)
Unrealized gain on securities, net of tax 11
Unrealized gains on cash flow
hedges, net of tax 66
Comprehensive income $ 53
Stock option and incentive plans, net 2,385 2 10 12
Convertible securities 7,118 7 48 55
Series B convertible preferred stock
dividends ($10.94 per share), net of tax (73) (73)
Equity for debt exchanges 6,412 6 45 51
Other 44 (1) (1) (2)
Balance at December 31, 2002 738,273 $738 $2,001 $1,025 $(1,871) $1,893
Net income 360 360
Translation adjustments 547 547
Minimum pension liability, net of tax 42 42
Unrealized gain on securities, net of tax 17 17
Unrealized gains on cash flow hedges, net of tax 2 2
Comprehensive income $ 968
Stock option and incentive plans, net 9,530 9 41 50
Common stock offering 46,000 46 405 451
Series B convertible preferred stock
dividends ($6.25 per share), net of tax (41) (41)
Series C mandatory convertible preferred
stock dividends ($3.23 per share) (30) (30)
Other 81 1 (2) 1 –
Balance at December 31, 2003 793,884 $794 $2,445 $1,315 $(1,263) $3,291
(1) As of December 31, 2003, Accumulated Other Comprehensive Loss is composed of cumulative translation adjustments of $(977), unrealized gain on
securities of $17, minimum pension liabilities of $(304) and cash flow hedging gains of $1.
(2) Includes reclassification adjustments for foreign currency translation losses of $59, that were realized in 2002 due to the sale of businesses. These
amounts were included in accumulated other comprehensive loss in prior periods as unrealized losses. Refer to Note 3 for further discussion.
The accompanying notes are an integral part of the Consolidated Financial Statements.