Xerox 2003 Annual Report Download - page 42
Download and view the complete annual report
Please find page 42 of the 2003 Xerox annual report below. You can navigate through the pages in the report by either clicking on the pages listed below, or by using the keyword search tool below to find specific information within the annual report.-
 1
1 -
2
-
3
-
4
-
5
-
6
-
7
-
8
-
9
-
10
-
11
-
12
-
13
-
14
-
15
-
16
-
17
-
18
-
19
-
20
-
21
-
22
-
23
-
24
-
25
-
26
-
27
-
28
-
29
-
30
-
31
-
 32
32 -
 33
33 -
 34
34 -
 35
35 -
 36
36 -
 37
37 -
 38
38 -
 39
39 -
 40
40 -
 41
41 -
 42
42 -
 43
43 -
 44
44 -
 45
45 -
 46
46 -
 47
47 -
 48
48 -
 49
49 -
 50
50 -
 51
51 -
 52
52 -
53
-
54
-
55
-
56
-
57
-
58
-
59
-
60
-
61
-
62
-
63
-
64
-
65
-
66
-
67
-
68
-
69
-
70
-
71
-
72
-
73
-
74
-
75
-
76
-
77
-
78
-
79
-
80
-
81
-
82
-
83
-
84
-
85
-
86
-
87
-
88
-
89
-
90
-
91
-
92
-
93
-
94
-
95
-
96
-
97
-
98
-
99
-
100
 |
 |

40
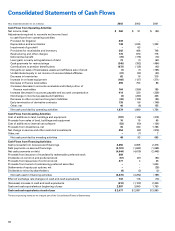
Consolidated Statements of Cash Flows
Year ended December 31, (in millions) 2003 2002 2001
Cash Flows from Operating Activities:
Net income (loss) $ 360 $ 91 $ (94)
Adjustments required to reconcile net income (loss)
to cash flows from operating activities:
Provision for litigation 239 ––
Depreciation and amortization 748 1,035 1,332
Impairment of goodwill –63 –
Provisions for receivables and inventory 302 468 748
Restructuring and other charges 176 670 715
Deferred tax benefit (70) (178) (10)
Loss (gain) on early extinguishment of debt 73 (1) (63)
Cash payments for restructurings (345) (392) (484)
Contributions to pension benefit plans (672) (138) (42)
Net gains on sales of businesses, assets and affiliate’s sale of stock (1) (1) (765)
Undistributed equity in net income of unconsolidated affiliates (37) (23) (20)
Decrease in inventories 62 16 319
Increase in on-lease equipment (166) (127) (271)
Decrease in finance receivables 496 754 88
(Increase) decrease in accounts receivable and billed portion of
finance receivables 164 (266) 189
Increase (decrease) in accounts payable and accrued compensation 414 330 (228)
Net change in income tax assets and liabilities (3) (260) 428
Decrease in other current and long-term liabilities (43) (109) (95)
Early termination of derivative contracts 136 56 (148)
Other, net 46 (8) 155
Net cash provided by operating activities 1,879 1,980 1,754
Cash Flows from Investing Activities:
Cost of additions to land, buildings and equipment (197) (146) (219)
Proceeds from sales of land, buildings and equipment 10 19 69
Cost of additions to internal use software (53) (50) (124)
Proceeds from divestitures, net 35 340 1,768
Net change in escrow and other restricted investments 254 (63) (816)
Other, net –(7) 7
Net cash provided by investing activities 49 93 685
Cash Flows from Financing Activities:
Cash proceeds from new secured financings 2,450 3,055 2,418
Debt payments on secured financings (2,181) (1,662) (1,068)
Net cash payments on debt (4,044) (4,619) (2,448)
Proceeds from issuance of mandatorily redeemable preferred stock 889 ––
Dividends on common and preferred stock (57) (67) (93)
Proceeds from issuances of common stock 477 428
Proceeds from loans to trusts issuing preferred securities –– 1,004
Settlements of equity put options, net –– (28)
Dividends to minority shareholders (4) (3) (2)
Net cash used in financing activities (2,470) (3,292) (189)
Effect of exchange rate changes on cash and cash equivalents 132 116 (10)
(Decrease) increase in cash and cash equivalents (410) (1,103) 2,240
Cash and cash equivalents at beginning of year 2,887 3,990 1,750
Cash and cash equivalents at end of year $ 2,477 $ 2,887 $ 3,990
The accompanying notes are an integral part of the Consolidated Financial Statements.