Xerox 2003 Annual Report Download - page 2
Download and view the complete annual report
Please find page 2 of the 2003 Xerox annual report below. You can navigate through the pages in the report by either clicking on the pages listed below, or by using the keyword search tool below to find specific information within the annual report.-
 1
1 -
 2
2 -
 3
3 -
 4
4 -
 5
5 -
 6
6 -
 7
7 -
 8
8 -
 9
9 -
 10
10 -
 11
11 -
 12
12 -
 13
13 -
 14
14 -
 15
15 -
 16
16 -
 17
17 -
 18
18 -
 19
19 -
 20
20 -
 21
21 -
 22
22 -
 23
23 -
 24
24 -
 25
25 -
 26
26 -
 27
27 -
 28
28 -
 29
29 -
 30
30 -
 31
31 -
 32
32 -
 33
33 -
 34
34 -
 35
35 -
 36
36 -
 37
37 -
 38
38 -
 39
39 -
 40
40 -
 41
41 -
 42
42 -
 43
43 -
 44
44 -
 45
45 -
 46
46 -
 47
47 -
 48
48 -
 49
49 -
 50
50 -
 51
51 -
 52
52 -
 53
53 -
 54
54 -
 55
55 -
 56
56 -
 57
57 -
 58
58 -
 59
59 -
 60
60 -
 61
61 -
 62
62 -
 63
63 -
 64
64 -
 65
65 -
 66
66 -
 67
67 -
 68
68 -
 69
69 -
 70
70 -
 71
71 -
 72
72 -
 73
73 -
 74
74 -
 75
75 -
 76
76 -
 77
77 -
 78
78 -
 79
79 -
 80
80 -
 81
81 -
 82
82 -
 83
83 -
 84
84 -
 85
85 -
 86
86 -
 87
87 -
 88
88 -
 89
89 -
 90
90 -
 91
91 -
 92
92 -
 93
93 -
 94
94 -
 95
95 -
 96
96 -
 97
97 -
 98
98 -
 99
99 -
 100
100
 |
 |

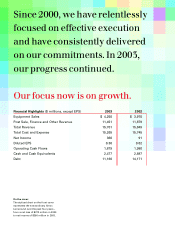
Financial Highlights ($ millions, except EPS) 2003 2002
Equipment Sales $ 4,250 $ 3,970
Post Sale, Finance and Other Revenue 11,451 11,879
Total Revenue 15,701 15,849
Total Cost and Expense 15,265 15,745
Net Income 360 91
Diluted EPS 0.36 0.02
Operating Cash Flows 1,879 1,980
Cash and Cash Equivalents 2,477 2,887
Debt 11,166 14,171
Since 2000, we have relentlessly
focused on effective execution
and have consistently delivered
on our commitments. In 2003,
our progress continued.
Our focus now is on growth.
On the cover:
The stylized chart on the front cover
represents the extraordinary Xerox
turnaround over the past four years –
from a net loss of $273 million in 2000
to net income of $360 million in 2003.
