Xerox 2003 Annual Report Download - page 58
Download and view the complete annual report
Please find page 58 of the 2003 Xerox annual report below. You can navigate through the pages in the report by either clicking on the pages listed below, or by using the keyword search tool below to find specific information within the annual report.-
 1
1 -
2
-
3
-
4
-
5
-
6
-
7
-
8
-
9
-
10
-
11
-
12
-
13
-
14
-
15
-
16
-
17
-
18
-
19
-
20
-
21
-
22
-
23
-
24
-
25
-
26
-
27
-
28
-
29
-
30
-
31
-
32
-
33
-
34
-
35
-
36
-
37
-
38
-
39
-
40
-
41
-
42
-
43
-
44
-
45
-
46
-
47
-
 48
48 -
 49
49 -
 50
50 -
 51
51 -
 52
52 -
 53
53 -
 54
54 -
 55
55 -
 56
56 -
 57
57 -
 58
58 -
 59
59 -
 60
60 -
 61
61 -
 62
62 -
 63
63 -
 64
64 -
 65
65 -
 66
66 -
 67
67 -
 68
68 -
69
-
70
-
71
-
72
-
73
-
74
-
75
-
76
-
77
-
78
-
79
-
80
-
81
-
82
-
83
-
84
-
85
-
86
-
87
-
88
-
89
-
90
-
91
-
92
-
93
-
94
-
95
-
96
-
97
-
98
-
99
-
100
 |
 |

56
same as those described in the summary of significant
accounting policies included in Note 1.
The Production segment includes black and white
products which operate at speeds over 90 pages per
minute and color products which operate at speeds
over 40 pages per minute. Products include the
DocuTech, DocuPrint, Xerox 1010 and Xerox 2101 and
DocuColor families, as well as older technology light-
lens products. These products are sold, predominantly
through direct sales channels in North America and
Europe, to Fortune 1000, graphic arts, government,
education and other public sector customers.
The Office segment includes black and white prod-
ucts which operate at speeds up to 90 pages per
minute and color devices up to 40 pages per minute.
Products include our family of Document Centre digi-
tal multifunction products and our new suite of
CopyCentre, WorkCentre, and WorkCentre Pro digital
multifunction systems, DocuColor color multifunction
products, color laser, solid ink and monochrome laser
desktop printers, digital and light-lens copiers and fac-
simile products. These products are sold through
direct and indirect sales channels in North America
and Europe to global, national and mid-size commer-
cial customers as well as government, education and
other public sector customers.
The DMO segment includes our operations in
Latin America, the Middle East, India, Eurasia, Russia
and Africa. This segment includes sales of products
that are typical to the aforementioned segments, how-
ever, management serves and evaluates these mar-
kets on an aggregate geographic basis, rather than on
a product basis.
The segment classified as Other, includes several
units, none of which met the thresholds for separate
segment reporting. This group primarily includes
Xerox Supplies Group (predominantly paper), Small
Office/Home Office (“SOHO”), Xerox Engineering
Systems, Xerox Technology Enterprises and consult-
ing services, royalty and license revenues. Other seg-
ment profit (loss) includes the operating results from
these entities, other less significant businesses, our
equity income from Fuji Xerox, and certain costs
which have not been allocated to the Production,
Office and DMO segments including non-financing
interest and other corporate costs.
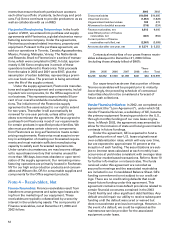
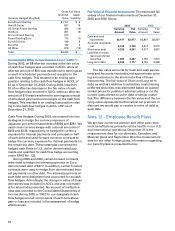
Selected financial information for our operating
segments for each of the three years ended December
31, 2003 was as follows:
Production Office DMO Other Total
2003 (1)
Information about profit or loss:
Revenues $4,171 $7,108 $1,607 $1,818 $14,704
Finance income 376 595 9 17 997
Total segment revenues $4,547 $7,703 $1,616 $1,835 $15,701
Interest expense (2) $ 121 $ 181 $ 34 $ 548 $ 884
Segment profit (loss) (3)(4) 422 753 151 (411) 915
Equity in net income of unconsolidated affiliates –165158
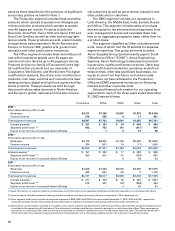
2002 (1)
Information about profit or loss:
Revenues $4,128 $6,940 $1,742 $2,039 $14,849
Finance income 394 601 16 (11) 1,000
Total segment revenues $4,522 $7,541 $1,758 $2,028 $15,849
Interest expense (2) $ 157 $ 223 $ 17 $ 499 $ 896
Segment profit (loss) (3)(4) 450 621 91 (329) 833
Equity in net income of unconsolidated affiliates – – 5 49 54
2001 (1)
Information about profit or loss:
Revenues $4,288 $7,356 $2,000 $2,235 $15,879
Finance income 439 661 26 3 1,129
Total segment revenues $4,727 $8,017 $2,026 $2,238 $17,008
Interest expense (2) $ 217 $ 304 $ 48 $ 432 $ 1,001
Segment profit (loss) (3)(4) 372 427 (97) (398) 304
Equity in net income of unconsolidated affiliates – – 4 49 53
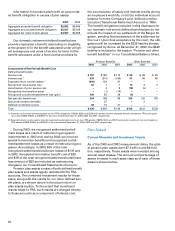
(1) Asset information on a segment basis is not disclosed as this information is not separately identified and internally reported to our chief executive officer.
(2) Interest expense includes equipment financing interest as well as non-financing interest, which is a component of Other expenses, net.
(3) Other segment profit (loss) includes net corporate expenses of $529, $362 and $130 for the years ended December 31, 2003, 2002 and 2001, respectively.
Corporate expenses include interest expense associated with our liability to subsidiary trusts issuing preferred securities (see Note 14).
(4) Depreciation and amortization expense is recorded in cost of sales, research and development expenses and selling, administrative and general expenses and
is included in the segment profit (loss) above. This information is neither identified nor internally reported to our chief executive officer. These expenses are
recorded by our operating units in the accounting records based on individual assessments as to how the related assets are used. The separate identification
of this information for purposes of segment disclosure is impracticable, as it is not readily available and the cost to develop it would be excessive.