Xerox 2003 Annual Report Download - page 68
Download and view the complete annual report
Please find page 68 of the 2003 Xerox annual report below. You can navigate through the pages in the report by either clicking on the pages listed below, or by using the keyword search tool below to find specific information within the annual report.-
 1
1 -
2
-
3
-
4
-
5
-
6
-
7
-
8
-
9
-
10
-
11
-
12
-
13
-
14
-
15
-
16
-
17
-
18
-
19
-
20
-
21
-
22
-
23
-
24
-
25
-
26
-
27
-
28
-
29
-
30
-
31
-
32
-
33
-
34
-
35
-
36
-
37
-
38
-
39
-
40
-
41
-
42
-
43
-
44
-
45
-
46
-
47
-
48
-
49
-
50
-
51
-
52
-
53
-
54
-
55
-
56
-
57
-
 58
58 -
 59
59 -
 60
60 -
 61
61 -
 62
62 -
 63
63 -
 64
64 -
 65
65 -
 66
66 -
 67
67 -
 68
68 -
 69
69 -
 70
70 -
 71
71 -
 72
72 -
 73
73 -
 74
74 -
 75
75 -
 76
76 -
 77
77 -
 78
78 -
79
-
80
-
81
-
82
-
83
-
84
-
85
-
86
-
87
-
88
-
89
-
90
-
91
-
92
-
93
-
94
-
95
-
96
-
97
-
98
-
99
-
100
 |
 |

66
Pension Benefits Other Benefits
2003 2002 2001 2003 2002 2001
Components of Net Periodic Benefit Cost
Defined benefit plans
Service cost $ 197 $ 180 $ 174 $ 26 $ 26 $ 28
Interest cost (1) 934 (210) (184) 91 96 99
Expected return on plan assets (2) (940) 134 81 –––
Recognized net actuarial loss 53 7713 33
Amortization of prior service cost –39(18) (5) –
Recognized net transition asset –(1) (14) –––
Recognized curtailment/settlement loss (gain) 120 55 26 (4) ––
Net periodic benefit cost 364 168 99 108 120 130
Special termination benefits –27 – –2–
Defined contribution plans 62 10 21 –––
Total $ 426 $ 205 $ 120 $108 $122 $130
(1) Interest cost includes interest expense on non-TRA obligations of $289, $238, and $216 and interest (income) expense directly allocated to TRA participant
accounts of $645, $(448), and $(400) for the years ended December 31, 2003, 2002 and 2001, respectively.
(2) Expected return on plan assets includes expected investment income on non-TRA assets of $295, $314, and $319 and actual investment income (losses) on
TRA assets of $645, $(448), and $(400) for the years ended December 31, 2003, 2002 and 2001, respectively.
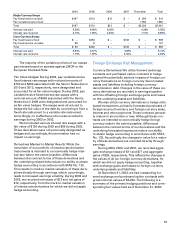
Information for pension plans with an accumulat-
ed benefit obligation in excess of plan assets:
2003 2002
Aggregate projected benefit obligation $5,882 $5,845
Aggregate accumulated benefit obligation $5,207 $5,188
Aggregate fair value of plan assets $4,367 $4,008
Our domestic retirement defined benefit plans
provide employees a benefit, depending on eligibility,
at the greater of (i) the benefit calculated under a high-
est average pay and years of service formula, (ii) the
benefit calculated under a formula that provides for
the accumulation of salary and interest credits during
an employee’s work life, or (iii) the individual account
balance from the Company’s prior defined contribu-
tion plan (Transitional Retirement Account or TRA).
The benefit obligations included in this disclosure for
our domestic retirement defined benefit plans do not
include the impact of our settlement of the Berger liti-
gation, pending final acceptance of the settlement by
the court. Upon final acceptance by the court, the obli-
gations will be increased by the $239 liability already
recognized by Xerox. At December 31, 2003, the $239
liability is included in the caption “Pension and other
benefit liabilities” in our Consolidated Balance Sheet.
During 2003, we recognized settlement/curtail-
ment losses as a result of restructuring programs
implemented in 2002 and, during 2002, we incurred
special termination benefits and recognized curtail-
ment/settlement losses as a result of restructuring pro-
grams. Accordingly, in 2003, $33 of the total
recognized settlement/curtailment losses of $116 and
in 2002, the special termination benefit cost of $29,
and $18 of the total recognized settlement/curtailment
loss amount of $55 are included as restructuring
charges in our Consolidated Statements of Income.
Pension plan assets consist of both defined benefit
plan assets and assets legally restricted to the TRA
accounts. The combined investment results for these
plans, along with the results for our other defined ben-
efit plans, are shown above in the actual return on
plan assets caption. To the extent that investment
results relate to TRA, such results are charged directly
to these accounts as a component of interest cost.
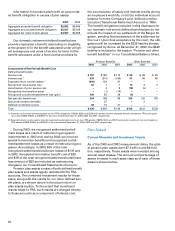
Plan Assets
Current Allocation and Investment Targets
As of the 2003 and 2002 measurement dates, the glob-
al pension plan assets were $7.3 billion and $6.0 bil-
lion, respectively. These assets were invested among
several asset classes. The amount and percentage of
assets invested in each asset class as of each of these
dates is shown below: