Xerox 2003 Annual Report Download - page 59
Download and view the complete annual report
Please find page 59 of the 2003 Xerox annual report below. You can navigate through the pages in the report by either clicking on the pages listed below, or by using the keyword search tool below to find specific information within the annual report.-
 1
1 -
2
-
3
-
4
-
5
-
6
-
7
-
8
-
9
-
10
-
11
-
12
-
13
-
14
-
15
-
16
-
17
-
18
-
19
-
20
-
21
-
22
-
23
-
24
-
25
-
26
-
27
-
28
-
29
-
30
-
31
-
32
-
33
-
34
-
35
-
36
-
37
-
38
-
39
-
40
-
41
-
42
-
43
-
44
-
45
-
46
-
47
-
48
-
 49
49 -
 50
50 -
 51
51 -
 52
52 -
 53
53 -
 54
54 -
 55
55 -
 56
56 -
 57
57 -
 58
58 -
 59
59 -
 60
60 -
 61
61 -
 62
62 -
 63
63 -
 64
64 -
 65
65 -
 66
66 -
 67
67 -
 68
68 -
 69
69 -
70
-
71
-
72
-
73
-
74
-
75
-
76
-
77
-
78
-
79
-
80
-
81
-
82
-
83
-
84
-
85
-
86
-
87
-
88
-
89
-
90
-
91
-
92
-
93
-
94
-
95
-
96
-
97
-
98
-
99
-
100
 |
 |

57
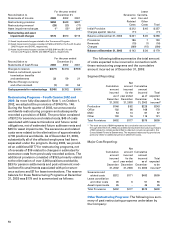
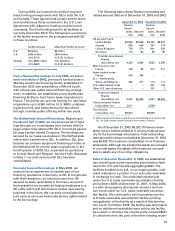
The following is a reconciliation of segment profit
to total company pre-tax income (loss):
Years ended December 31, 2003 2002 2001
Total segment profit $ 915 $ 833 $ 304
Unallocated items:
Restructuring and asset
impairment charges (176) (670) (715)
Gain on early extinguishment
of debt ––63
Restructuring related inventory
write-down charges –(2) (42)
Provision for litigation (239) ––
Gain on sale of Fuji Xerox interest –– 773
Other expenses (6) (3) (2)
Allocated item:
Equity in net income of
unconsolidated affiliates (58) (54) (53)
Pre-tax income $ 436 $ 104 $ 328
Geographic area data was as follows:
Revenues Long-Lived Assets (1)
2003 2002(2) 2001 2003 2002 2001
United States $ 8,547 $ 9,096 $10,034 $1,477 $1,524 $1,880
Europe 4,863 4,425 5,039 616 718 767
Other Areas 2,291 2,328 1,935 460 379 706
Total $15,701 $15,849 $17,008 $2,553 $2,621 $3,353
(1) Long-lived assets are comprised of (i) land, buildings and equipment, net, (ii) on-lease equipment, net, and (iii) capitalized software costs, net.
(2) Amounts have been revised to reflect reclassification of revenues previously reported in the United States.
Note 9 – Supplementary Financial
Information
The components of other current assets and other cur-
rent liabilities at December 31, 2003 and 2002 were as
follows:
2003 2002
Other current assets
Deferred taxes $ 402 $ 449
Restricted cash 386 263
Prepaid expenses 35 140
Financial derivative instruments 24 85
Other 258 250
Total $1,105 $1,187
Other current liabilities
Income taxes payable $ 264 $ 236
Other taxes payable 289 177
Interest payable 147 187
Restructuring reserves 180 286
Due to Fuji Xerox 111 117
Financial derivative instruments 51 70
Other 610 760
Total $1,652 $1,833
The components of other long-term assets and
other long-term liabilities at December 31, 2003 and
2002 were as follows:
2003 2002
Other long-term assets
Prepaid pension costs $ 736 $ 611
Net investment in discontinued operations 449 728
Internal use software, net 307 341
Restricted cash 343 414
Investments in non-affiliated companies 104 24
Financial derivative instruments 89 122
Debt issuance costs 79 159
Other 370 351
Total other long-term assets $2,477 $2,750
Other long-term liabilities
Deferred and other tax liabilities $ 809 $ 831
Minorities’ interests in equity of subsidiaries 102 73
Financial derivative instruments 11 14
Other 356 299
Total other long-term liabilities $1,278 $1,217
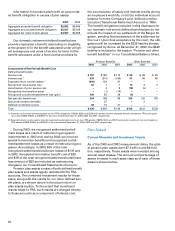
Net investment in discontinued operations: Our net
investment in discontinued operations is primarily
related to the disengagement from our former insur-
ance holding company, Talegen Holdings, Inc.
(“Talegen”), and consists of our net investment in