Xerox 2003 Annual Report Download - page 28
Download and view the complete annual report
Please find page 28 of the 2003 Xerox annual report below. You can navigate through the pages in the report by either clicking on the pages listed below, or by using the keyword search tool below to find specific information within the annual report.-
 1
1 -
2
-
3
-
4
-
5
-
6
-
7
-
8
-
9
-
10
-
11
-
12
-
13
-
14
-
15
-
16
-
17
-
 18
18 -
 19
19 -
 20
20 -
 21
21 -
 22
22 -
 23
23 -
 24
24 -
 25
25 -
 26
26 -
 27
27 -
 28
28 -
 29
29 -
 30
30 -
 31
31 -
 32
32 -
 33
33 -
 34
34 -
 35
35 -
 36
36 -
 37
37 -
 38
38 -
39
-
40
-
41
-
42
-
43
-
44
-
45
-
46
-
47
-
48
-
49
-
50
-
51
-
52
-
53
-
54
-
55
-
56
-
57
-
58
-
59
-
60
-
61
-
62
-
63
-
64
-
65
-
66
-
67
-
68
-
69
-
70
-
71
-
72
-
73
-
74
-
75
-
76
-
77
-
78
-
79
-
80
-
81
-
82
-
83
-
84
-
85
-
86
-
87
-
88
-
89
-
90
-
91
-
92
-
93
-
94
-
95
-
96
-
97
-
98
-
99
-
100
 |
 |

26
as equipment sales increase and our services and
solutions increase utilization of the equipment.
Accordingly, we expect 2004 total revenues to be in
line with 2003 levels.
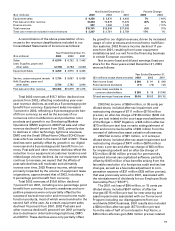
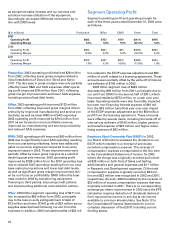
Segment Operating Profit:
Segment operating profit and operating margin for
each of the three years ended December 31, 2003 were
as follows:
Production: 2003 operating profit declined $28 million
from 2002, reflecting lower gross margins related to
initial installations of DocuColor iGen3 and Xerox
2101. The decrease in gross margins was only partially
offset by lower R&D and SAG expenses. 2002 operat-
ing profit improved $78 million from 2001, reflecting
gross margin improvements and lower SAG expense,
including reduced bad debt levels.
Office: 2003 operating profit improved $132 million
from 2002, reflecting improved gross margins driven
primarily by improved manufacturing and service pro-
ductivity, as well as lower R&D and SAG expenses.
2002 operating profit improved by $194 million from
2001 as we focused on more profitable revenue,
improved our manufacturing and service productivity
and reduced SAG expenses.
DMO: 2003 operating profit improved $60 million from
2002 due to significantly lower SAG spending resulting
from our cost saving initiatives, lower bad debts and
gains on currency exposures compared to currency
exposure losses in 2002. These improvements were
partially offset by lower gross margins as a result of
declining post sale revenue. 2002 operating profit
improved by $188 million from the 2001 operating loss
due to reduced SAG spending resulting from our cost
base restructuring actions and lower bad debt levels,
as well as significant gross margin improvement driv-
en by our focus on profitability. DMO refined its busi-
ness model in 2002 by transitioning equipment
financing to third parties, improving credit policies
and implementing additional cost reduction actions.
Other: 2003 Other segment operating loss of $411 mil-
lion increased by $82 million from 2002, principally
due to the loss on early extinguishment of debt of
$73 million and lower SOHO profit of $39 million as our
supplies sales declined following our exit from this
business. In addition, 2002 included benefits of $33 mil-
lion related to the ESOP expense adjustment and $50
million of profit related to a licensing agreement. These
amounts were partially offset by the write-off of internal
use software of $106 million in 2002.
2002 Other segment loss of $329 million
decreased by $69 million from 2001, principally due to
our exit from SOHO in the second half of 2001, which
improved results by $272 million on a year over year
basis. Operating results were also favorably impacted
by lower non-financing interest expense of $49 mil-
lion, the $33 million beneficial year over year impact
of the ESOP expense adjustment and the $50 million
profit from the licensing agreement. These amounts
were offset by several items, including the write-off of
internal use software of $106 million, higher pension
and benefit expense of $93 million and higher adver-
tising expenses of $62 million.
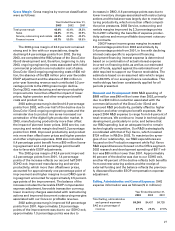
Employee Stock Ownership Plan (ESOP): In 2002,
our Board of Directors reinstated the dividend on our
ESOP, which resulted in a reversal of previously
recorded compensation expense. The reversal of
compensation expense corresponded to the line item
in the Consolidated Statement of Income for 2002
where the charge was originally recorded and includ-
ed $28 million in both Cost of Sales and Selling,
administrative and general expenses and $11 million
in Research and Development expenses. Of the total
compensation expense originally recorded, $34 mil-
lion and $33 million was recognized in 2002 and 2001,
respectively. As such, 2002 benefited by the reversal of
$33 million of excess compensation expense that was
originally recorded in 2001. There is no corresponding
earnings per share improvement in 2002 since the EPS
calculation requires deduction of dividends declared
from reported net income in arriving at net income
available to common shareholders. See Note 12 to
the Consolidated Financial Statements for a more
complete discussion of the ESOP, including current
funding status.
($ in millions) Production Office DMO Other Total
2003
Operating Profit $422 $753 $151 $(411) $915
Operating Margin 9.3% 9.8% 9.3% (22.4%) 5.8%
2002
Operating Profit $450 $621 $91 $(329) $833
Operating Margin 10.0% 8.2% 5.2% (16.2%) 5.3%
2001
Operating Profit $372 $427 $(97) $(398) $304
Operating Margin 7.9% 5.3% (4.8%) (17.8%) 1.8%