Xerox 2003 Annual Report Download - page 51
Download and view the complete annual report
Please find page 51 of the 2003 Xerox annual report below. You can navigate through the pages in the report by either clicking on the pages listed below, or by using the keyword search tool below to find specific information within the annual report.-
 1
1 -
2
-
3
-
4
-
5
-
6
-
7
-
8
-
9
-
10
-
11
-
12
-
13
-
14
-
15
-
16
-
17
-
18
-
19
-
20
-
21
-
22
-
23
-
24
-
25
-
26
-
27
-
28
-
29
-
30
-
31
-
32
-
33
-
34
-
35
-
36
-
37
-
38
-
39
-
40
-
 41
41 -
 42
42 -
 43
43 -
 44
44 -
 45
45 -
 46
46 -
 47
47 -
 48
48 -
 49
49 -
 50
50 -
 51
51 -
 52
52 -
 53
53 -
 54
54 -
 55
55 -
 56
56 -
 57
57 -
 58
58 -
 59
59 -
 60
60 -
 61
61 -
62
-
63
-
64
-
65
-
66
-
67
-
68
-
69
-
70
-
71
-
72
-
73
-
74
-
75
-
76
-
77
-
78
-
79
-
80
-
81
-
82
-
83
-
84
-
85
-
86
-
87
-
88
-
89
-
90
-
91
-
92
-
93
-
94
-
95
-
96
-
97
-
98
-
99
-
100
 |
 |

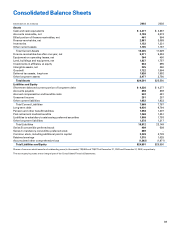
49
2003 2002 2001
Net income (loss) – as reported $ 360 $ 91 $ (94)
Deduct: Total stock-based
employee compensation
expense determined under
fair value based method
for all awards, net of tax (85) (83) (93)
Net income (loss) – pro forma $ 275 $ 8 $ (187)
Basic EPS – as reported $0.38 $ 0.02 $(0.15)
Basic EPS – pro forma 0.27 (0.09) (0.28)
Diluted EPS – as reported $0.36 $ 0.02 $(0.15)
Diluted EPS – pro forma 0.25 (0.09) (0.28)
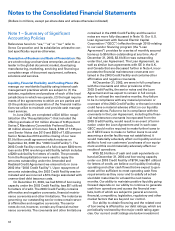
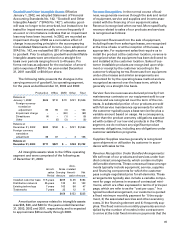
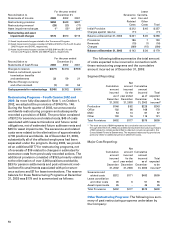
The pro forma periodic compensation expense
amounts may not be representative of future amounts
since the estimated fair value of stock options is amor-
tized to expense ratably over the vesting period, and
additional options may be granted in future years. As
reflected in the pro forma amounts in the previous
table, the weighted-average fair value of each option
granted in 2003, 2002 and 2001 was $5.39, $6.34 and
$2.40, respectively. The fair value of each option was
estimated on the date of grant using the following
weighted average assumptions:
2003 2002 2001
Risk-free interest rate 3.3% 4.8% 5.1%
Expected life in years 7.2 6.5 6.5
Expected price volatility 66.2% 61.5% 51.4%
Expected dividend yield – – 2.7%
Foreign Currency Translation: The functional currency
for most foreign operations is the local currency. Net
assets are translated at current rates of exchange, and
income, expense and cash flow items are translated at
the average exchange rate for the year. The translation
adjustments are recorded in Accumulated Other
Comprehensive Income. The U.S. dollar is used as the
functional currency for certain subsidiaries that conduct
their business in U.S. dollars or operate in hyperinfla-
tionary economies. A combination of current and his-
torical exchange rates is used in remeasuring the local
currency transactions of these subsidiaries, and the
resulting exchange adjustments are included in income.
Aggregate foreign currency losses were $11 and $77 in
2003 and 2002, respectively, and gains were $29 in
2001 and are included in Other expenses, net in the
accompanying Consolidated Statements of Income.
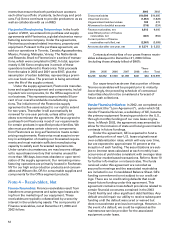
Note 2 – Restructuring Programs
We have engaged in a series of restructuring programs
related to downsizing our employee base, exiting cer-
tain businesses, outsourcing certain internal functions
and engaging in other actions designed to reduce our
cost structure and improve productivity. Management
continues to evaluate the business and, therefore,
there may be supplemental provisions for new plan
initiatives as well as changes in estimates to amounts
previously recorded, as payments are made or actions
are completed. Asset impairment charges were also
incurred in connection with these restructuring actions
for those assets made obsolete or redundant as a
result of these programs. The restructuring and asset
impairment charges in the Consolidated Statements of
Income totaled $176, $670 and $715 in 2003, 2002 and
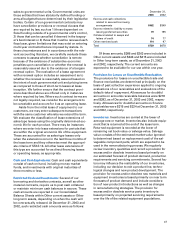
2001, respectively. Detailed information related to
restructuring program activity during the three years
ended December 31, 2003 is outlined below.
Fourth
Quarter
2002/2003 Turnaround 1998/ 2000
Restructuring Activity Program Program SOHO Programs TOTAL
Ending Balance December 31, 2000 $ – $ 71 $ – $ 256 $ 327
Provision – 401 101 85 587
Reversals of prior accruals – (26) (26) (25) (77)
Charges against reserve and currency – (223) (52) (280) (555)
Ending Balance December 31, 2001 $ – $ 223 $ 23 $ 36 $ 282
Provision 357 286 – 5 648
Reversals of prior accruals – (33) – – (33)
Charges against reserve and currency (71) (345) (17) (41) (474)
Ending Balance December 31, 2002 $ 286 $ 131 $ 6 $ – $ 423
Provision 193 11 – – 204
Reversals of prior accruals (16) (13) – – (29)
Charges against reserve and currency (284) (87) (6) – (377)
Ending Balance December 31, 2003 $ 179 $ 42 $ – $ – $ 221