Xerox 2003 Annual Report Download - page 21
Download and view the complete annual report
Please find page 21 of the 2003 Xerox annual report below. You can navigate through the pages in the report by either clicking on the pages listed below, or by using the keyword search tool below to find specific information within the annual report.-
 1
1 -
2
-
3
-
4
-
5
-
6
-
7
-
8
-
9
-
10
-
 11
11 -
 12
12 -
 13
13 -
 14
14 -
 15
15 -
 16
16 -
 17
17 -
 18
18 -
 19
19 -
 20
20 -
 21
21 -
 22
22 -
 23
23 -
 24
24 -
 25
25 -
 26
26 -
 27
27 -
 28
28 -
 29
29 -
 30
30 -
 31
31 -
32
-
33
-
34
-
35
-
36
-
37
-
38
-
39
-
40
-
41
-
42
-
43
-
44
-
45
-
46
-
47
-
48
-
49
-
50
-
51
-
52
-
53
-
54
-
55
-
56
-
57
-
58
-
59
-
60
-
61
-
62
-
63
-
64
-
65
-
66
-
67
-
68
-
69
-
70
-
71
-
72
-
73
-
74
-
75
-
76
-
77
-
78
-
79
-
80
-
81
-
82
-
83
-
84
-
85
-
86
-
87
-
88
-
89
-
90
-
91
-
92
-
93
-
94
-
95
-
96
-
97
-
98
-
99
-
100
 |
 |

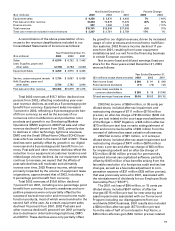
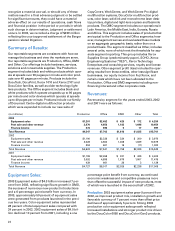
Year Ended December 31, Percent Change
($ in millions) 2003 2002 2001 2003 2002
Equipment sales $ 4,250 $ 3,970 $ 4,403 7% (10)%
Post sale and other revenue 10,454 10,879 11,476 (4)% (5)%
Finance income 997 1,000 1,129 –(11)%
Total revenues $15,701 $15,849 $17,008 (1)% (7)%
Total color revenue included in total revenues $ 3,267 $ 2,781 $ 2,759 17% 1%
A reconciliation of the above presentation of rev-
enues to the revenue classifications included in our
Consolidated Statements of Income is as follows:
Year Ended December 31,
($ in millions) 2003 2002 2001
Sales $ 6,970 $ 6,752 $ 7,443
Less: Supplies, paper and
other sales (2,720) (2,782) (3,040)
Equipment Sales $ 4,250 $ 3,970 $ 4,403
Service, outsourcing and rentals $ 7,734 $ 8,097 $ 8,436
Add: Supplies, paper and
other sales 2,720 2,782 3,040
Post sale and other revenue $10,454 $10,879 $11,476
Total 2003 revenues of $15.7 billion declined one
percent from 2002, reflecting moderating year-over-
year revenue declines, as well as a 5-percentage point
benefit from currency. Equipment sales increased
7 percent in 2003, reflecting a 6-percentage point ben-
efit from currency, as well as the success of our
numerous color multifunction and production color
products and growth in our Developing Markets
Operations (DMO) segment. 2003 Post sale and other
revenue declined 4 percent from 2002, primarily due
to declines in older technology light lens revenues,
DMO and the Small Office/Home Office (SOHO) busi-
ness which we exited in the second half of 2001. These
declines were partially offset by growth in our digital
revenues and a 5-percentage point benefit from cur-
rency. Post sale and other revenue declines reflect the
reduction in our equipment at customer locations and
related page volume declines. As our equipment sales
continue to increase, we expect that the effects of
post-sale declines will moderate and ultimately
reverse over time. 2003 Finance income, which was
primarily impacted by the volume of equipment lease
originations, approximated that of 2002, including a
5-percentage point benefit from currency.
Total 2002 revenues of $15.8 billion declined
7 percent from 2001, including a one-percentage point
benefit from currency. Economic weakness and com-
petitive pressures were only partially offset by the
success of several new color and monochrome multi-
function products, most of which were launched in the
second half of the year. As a result, equipment sales
declined 10 percent from 2001. 2002 Post sale and
other revenue declined 5 percent from 2001 primarily
due to declines in older technology light lens, DMO
and SOHO. These declines were only partially offset
by growth in our digital revenues, driven by increased
usage of color products and monochrome multifunc-
tion systems. 2002 Finance income declined 11 per-
cent from 2001, resulting from lower equipment
installations and our exit from the financing business
in certain European countries.
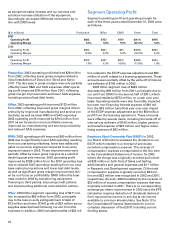
Net income (loss) and diluted earnings (loss) per
share for the three years ended December 31, 2003
were as follows:
Year Ended December 31,
($ in millions, except share amounts) 2003 2002 2001
Net income (loss) $ 360 $ 91 $ (94)
Preferred stock dividends (71) (73) (12)
Income (loss) available to
common shareholders $ 289 $ 18 $ (106)
Diluted earnings (loss) per share $0.36 $0.02 $(0.15)
2003 Net income of $360 million, or 36 cents per
diluted share, included after-tax impairment and
restructuring charges of $111 million ($176 million
pre-tax), an after-tax charge of $146 million ($239 mil-
lion pre-tax) related to the court approved settlement
of the Berger v. RIGP litigation, a $45 million after-tax
($73 million pre-tax) loss on early extinguishment of
debt and income tax benefits of $35 million from the
reversal of deferred tax asset valuation allowances.
2002 Net income of $91 million, or 2 cents per
diluted share, included after-tax asset impairment and
restructuring charges of $471 million ($670 million
pre-tax), a pre-tax and after-tax charge of $63 million
for impaired goodwill and an after-tax charge of
$72 million ($106 million pre-tax) for permanently
impaired internal-use capitalized software, partially
offset by $105 million of tax benefits arising from the
favorable resolution of a foreign tax audit and tax law
changes, as well as a favorable adjustment to com-
pensation expense of $31 million ($33 million pre-tax),
that was previously accrued in 2001, associated with
the reinstatement of dividends for our Employee Stock
Ownership Plan (“ESOP”).
The 2001 net loss of $94 million, or 15 cents per
diluted share, included $507 million of after-tax
charges ($715 million pre-tax) for restructuring and
asset impairments associated with our Turnaround
Program including our disengagement from our
worldwide SOHO business. 2001 results also included
a $304 million after-tax gain ($773 million pre-tax)
from the sale of half of our interest in Fuji Xerox, a
$38 million after-tax gain ($63 million pre-tax) related
19