Xerox 2003 Annual Report Download - page 69
Download and view the complete annual report
Please find page 69 of the 2003 Xerox annual report below. You can navigate through the pages in the report by either clicking on the pages listed below, or by using the keyword search tool below to find specific information within the annual report.-
 1
1 -
2
-
3
-
4
-
5
-
6
-
7
-
8
-
9
-
10
-
11
-
12
-
13
-
14
-
15
-
16
-
17
-
18
-
19
-
20
-
21
-
22
-
23
-
24
-
25
-
26
-
27
-
28
-
29
-
30
-
31
-
32
-
33
-
34
-
35
-
36
-
37
-
38
-
39
-
40
-
41
-
42
-
43
-
44
-
45
-
46
-
47
-
48
-
49
-
50
-
51
-
52
-
53
-
54
-
55
-
56
-
57
-
58
-
 59
59 -
 60
60 -
 61
61 -
 62
62 -
 63
63 -
 64
64 -
 65
65 -
 66
66 -
 67
67 -
 68
68 -
 69
69 -
 70
70 -
 71
71 -
 72
72 -
 73
73 -
 74
74 -
 75
75 -
 76
76 -
 77
77 -
 78
78 -
 79
79 -
80
-
81
-
82
-
83
-
84
-
85
-
86
-
87
-
88
-
89
-
90
-
91
-
92
-
93
-
94
-
95
-
96
-
97
-
98
-
99
-
100
 |
 |

67
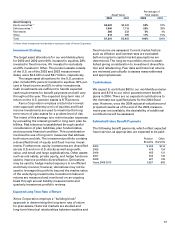
Investment Strategy
The target asset allocations for our worldwide plans
for 2003 and 2002 were 60% invested in equities, 28%
invested in fixed income, 4% invested in real estate
and 8% invested in Other. The pension assets outside
of the U.S. as of the 2003 and 2002 measurement
dates, were $3.4 billion and $2.7 billion, respectively.
The target asset allocations for the U.S. pension
plan include 65% percent invested in equities, 30% per-
cent in fixed income and 5% in other investments.
Cash investments are sufficient to handle expected
cash requirements for benefit payments and will vary
throughout the year. The expected long-term rate of
return on the U.S. pension assets is 8.75 percent.
Xerox Corporation employs a total return invest-
ment approach whereby a mix of equities and fixed
income investments are used to maximize the long-
term return of plan assets for a prudent level of risk.
The intent of this strategy is to minimize plan expenses
by exceeding the interest growth in long-term plan lia-
bilities. Risk tolerance is established through careful
consideration of plan liabilities, plan funded status,
and corporate financial condition. This consideration
involves the use of long-term measures that address
both return and risk. The investment portfolio contains
a diversified blend of equity and fixed income invest-
ments. Furthermore, equity investments are diversified
across U.S and non-U.S. stocks as well as growth,
value, and small and large capitalizations. Other assets
such as real estate, private equity, and hedge funds are
used to improve portfolio diversification. Derivatives
may be used to hedge market exposure in an efficient
and timely manner; however, derivatives may not be
used to leverage the portfolio beyond the market value
of the underlying investments. Investment risks and
returns are measured and monitored on an ongoing
basis through annual liability measurements and
quarterly investment portfolio reviews.
Expected Long Term Rate of Return
Xerox Corporation employs a “building block”
approach in determining the long-term rate of return
for plan assets. Historical markets are studied and
long-term historical relationships between equities and
fixed income are assessed. Current market factors
such as inflation and interest rates are evaluated
before long-term capital market assumptions are
determined. The long-term portfolio return is estab-
lished giving consideration to investment diversifica-
tion and rebalancing. Peer data and historical returns
are reviewed periodically to assess reasonableness
and appropriateness.
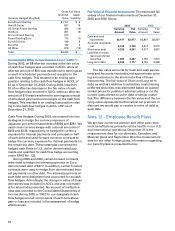
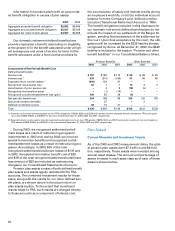
Contributions
We expect to contribute $63 to our worldwide pension
plans and $114 to our other postretirement benefit
plans in 2004. There are no expected contributions to
the domestic tax qualified plans for the 2004 fiscal
year. However, once the 2004 actuarial valuations and
projected results as of the end of the 2004 measure-
ment year are available, the desirability of additional
contributions will be assessed.
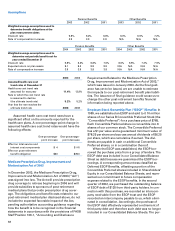
Estimated Future Benefit Payments
The following benefit payments, which reflect expected
future service, as appropriate, are expected to be paid:
Pension Other
Benefits Benefits
2004 $ 603 $114
2005 479 124
2006 455 131
2007 532 136
2008 627 138
Years 2009-2013 3,627 692
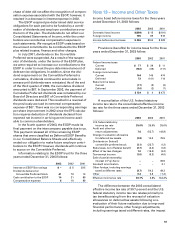
Percentage of
Asset Value Total Assets
2003 2002 2003 2002
Asset Category
Equity securities (1) $4,222 $3,422 58% 57%
Debt securities (1) 1,900 1,718 26% 29%
Real estate 366 238 5% 4%
Other 813 585 11% 10%
Total $7,301 $5,963 100% 100%
(1) None of the investments include debt or equity securities of Xerox Corporation.