Xerox 2003 Annual Report Download - page 29
Download and view the complete annual report
Please find page 29 of the 2003 Xerox annual report below. You can navigate through the pages in the report by either clicking on the pages listed below, or by using the keyword search tool below to find specific information within the annual report.-
 1
1 -
2
-
3
-
4
-
5
-
6
-
7
-
8
-
9
-
10
-
11
-
12
-
13
-
14
-
15
-
16
-
17
-
18
-
 19
19 -
 20
20 -
 21
21 -
 22
22 -
 23
23 -
 24
24 -
 25
25 -
 26
26 -
 27
27 -
 28
28 -
 29
29 -
 30
30 -
 31
31 -
 32
32 -
 33
33 -
 34
34 -
 35
35 -
 36
36 -
 37
37 -
 38
38 -
 39
39 -
40
-
41
-
42
-
43
-
44
-
45
-
46
-
47
-
48
-
49
-
50
-
51
-
52
-
53
-
54
-
55
-
56
-
57
-
58
-
59
-
60
-
61
-
62
-
63
-
64
-
65
-
66
-
67
-
68
-
69
-
70
-
71
-
72
-
73
-
74
-
75
-
76
-
77
-
78
-
79
-
80
-
81
-
82
-
83
-
84
-
85
-
86
-
87
-
88
-
89
-
90
-
91
-
92
-
93
-
94
-
95
-
96
-
97
-
98
-
99
-
100
 |
 |

27
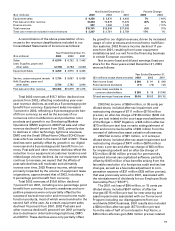
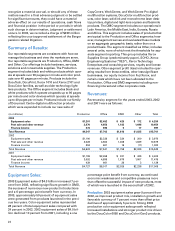
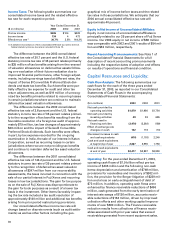
Gross Margin: Gross margins by revenue classification
were as follows:
Year Ended December 31,
2003 2002 2001
Total gross margin 42.0% 42.4% 38.2%
Sales 36.4% 37.3% 30.5%
Service, outsourcing and rentals 44.3% 44.5% 42.2%
Finance income 63.7% 59.9% 59.5%
The 2003 gross margin of 42.0 percent remained
strong and in line with our expectations, despite
declining 0.4 percentage points from 2002. During
2003, we completed the R&D phase of the DocuColor
iGen3 development and, therefore, beginning in July
2003, ongoing engineering costs associated with initial
commercial production are included in cost of sales.
DocuColor iGen3 ongoing engineering costs of $30 mil-
lion, the absence of the $28 million prior year favorable
ESOP adjustment and the absence of $50 million in
prior year licensing revenue each contributed 0.2 per-
centage points to the 2003 gross margin decline.
During 2003, manufacturing and service productivity
improvements more than offset the impact of lower
prices, higher pension and other employee benefit
costs and product mix.
2003 sales gross margin declined 0.9 percentage
points from 2002, with over half of the decline due to
DocuColor iGen3 ongoing engineering costs and the
remainder due to product mix as we increased our
penetration of the digital light production market. In
2003, manufacturing productivity more than offset
the impact of planned lower prices. 2003 service, out-
sourcing and rentals margin declined 0.2 percentage
points from 2002. Improved productivity and product
mix more than offset lower prices and higher pension
and other employee expenses. 2002 also included a
0.4 percentage point benefit from a $50 million licens-
ing agreement and a 0.3 percentage point benefit
due to favorable ESOP adjustments.
The 2002 gross margin of 42.4 percent improved
4.2 percentage points from 2001. 1.4 percentage
points of the increase reflects our second half 2001
SOHO exit. Improved manufacturing and service
productivity, which more than offsetlower prices,
accounted for approximately one percentage point of
improvement and higher margins in our DMO operat-
ing segment accounted for approximately 0.5 percent-
age points of the improvement. The balance of the
increase includes the favorable ESOP compensation
expense adjustment, favorable transaction currency,
lower inventory charges associated with restructuring
actions and improved document outsourcing margins
associated with our focus on profitable revenue.
2002 sales gross margin improved 6.8 percentage
points from 2001. Approximately 2.6 percentage
points of the improvement was due to our SOHO exit,
approximately 1.3 percentage points was due to
increases in DMO, 0.6 percentage points was due to
lower inventory charges associated with restructuring
actions and the balance was largely due to manufac-
turing productivity, which more than offset competi-
tive price pressures. 2002 Service, outsourcing and
rentals margins improved by 2.3 percentage points
from 2001 reflecting the benefits of expense produc-
tivity actions and more profitable document outsourc-
ing contracts.
2003 Finance income gross margins increased
3.8 percentage points from 2002 and similarly by
0.4 percentage points from 2001, in line with declining
interest costs specific to equipment financing.
Equipment financing interest expense is determined
based on a combination of actual interest expense
incurred on financing debt, as well as our estimated
cost of funds, applied against the estimated level of
debt required to support our finance receivables. The
estimate is based on an assumed ratio which ranges
from 80-90% of our average finance receivables. This
methodology has been consistently applied for all
periods presented.
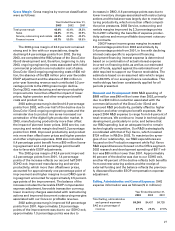
Research and Development: 2003 R&D spending of
$868 million was $49 million lower than 2002, primarily
due to a $30 million reduction associated with the
commercial launch of the DocuColor iGen3 and
improved R&D productivity, partially offset by higher
pension and other employee benefit expenses. We
expect 2004 R&D expense to range from 5-6 percent of
total revenues. We continue to invest in technological
development, particularly in color, and believe that
our R&D spending is at an adequate level to remain
technologically competitive. Our R&D is strategically
coordinated with that of Fuji Xerox, which invested
$724 million in R&D in 2003. To maximize the syner-
gies of our relationship, our R&D expenditures are
focused on the Production segment while Fuji Xerox
R&D expenditures are focused on the Office segment.
2002 research and development spending of $917 mil-
lion was $80 million lower than 2001. Approximately
40 percent of the decline was due to our SOHO exit,
another 40 percent of the decline reflects both benefits
from cost restructuring actions and the receipt of
external funding and the balance reflects the previous-
ly discussed favorable ESOP compensation expense
adjustment.
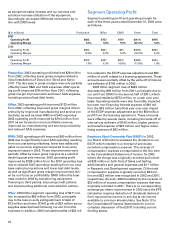
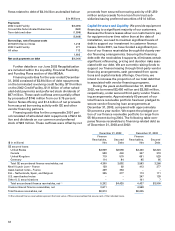
Selling, Administrative and General Expenses: SAG
expense information was as follows ($ in millions):
Year Ended December 31,
2003 2002 2001
Total Selling, administrative
and general expenses $4,249 $4,437 $4,728
SAG as a percentage of
revenue 27.1% 28.0% 27.8%