Xerox 2003 Annual Report Download - page 32
Download and view the complete annual report
Please find page 32 of the 2003 Xerox annual report below. You can navigate through the pages in the report by either clicking on the pages listed below, or by using the keyword search tool below to find specific information within the annual report.-
 1
1 -
2
-
3
-
4
-
5
-
6
-
7
-
8
-
9
-
10
-
11
-
12
-
13
-
14
-
15
-
16
-
17
-
18
-
19
-
20
-
21
-
 22
22 -
 23
23 -
 24
24 -
 25
25 -
 26
26 -
 27
27 -
 28
28 -
 29
29 -
 30
30 -
 31
31 -
 32
32 -
 33
33 -
 34
34 -
 35
35 -
 36
36 -
 37
37 -
 38
38 -
 39
39 -
 40
40 -
 41
41 -
 42
42 -
43
-
44
-
45
-
46
-
47
-
48
-
49
-
50
-
51
-
52
-
53
-
54
-
55
-
56
-
57
-
58
-
59
-
60
-
61
-
62
-
63
-
64
-
65
-
66
-
67
-
68
-
69
-
70
-
71
-
72
-
73
-
74
-
75
-
76
-
77
-
78
-
79
-
80
-
81
-
82
-
83
-
84
-
85
-
86
-
87
-
88
-
89
-
90
-
91
-
92
-
93
-
94
-
95
-
96
-
97
-
98
-
99
-
100
 |
 |

30
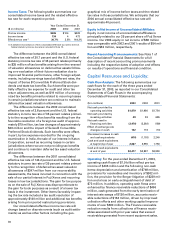
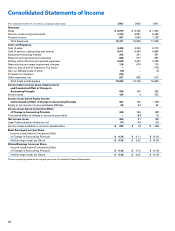
Income Taxes: The following table summarizes our
consolidated income taxes and the related effective
tax rate for each respective period:
Year Ended December 31,
($ in millions) 2003 2002 2001
Pre-tax income $436 $104 $328
Income taxes 134 4 473
Effective tax rate (1) 30.7% 3.8% 144.2%
(1) A detailed reconciliation of the consolidated effective tax rate to the U.S.
federal statutory income tax rate is included in Note 13.
The difference between the 2003 consolidated
effective tax rate of 30.7 percent and the U.S. federal
statutory income tax rate of 35 percent relates primarily
to $35 million of tax benefits arising from the reversal
of valuation allowances on deferred tax assets follow-
ing a re-evaluation of their future realization due to
improved financial performance, other foreign adjust-
ments, including earnings taxed at different rates, the
impact of Series B Convertible Preferred Stock divi-
dends and state tax benefits. Such benefits were par-
tially offset by tax expense for audit and other tax
return adjustments, as well as $19 million of unrecog-
nized tax benefits primarily related to recurring losses
in certain jurisdictions where we continue to maintain
deferred tax asset valuation allowances.
The difference between the 2002 consolidated
effective tax rate of 3.8 percent and the U.S. federal
statutory income tax rate of 35 percent relates primari-
ly to the recognition of tax benefits resulting from the
favorable resolution of a foreign tax audit of approxi-
mately $79 million, tax law changes of approximately
$26 million and the impact of Series B Convertible
Preferred Stock dividends. Such benefits were offset,
in part, by tax expense recorded for the on-going
examination in India, the sale of our interest in Katun
Corporation, as well as recurring losses in certain
jurisdictions where we are not providing tax benefits
and continue to maintain deferred tax asset valuation
allowances.
The difference between the 2001 consolidated
effective tax rate of 144.2 percent and the U.S. federal
statutory income tax rate of 35 percent relates primari-
ly to the recognition of deferred tax asset valuation
allowances of $247 million from our recoverability
assessments, the taxes incurred in connection with the
sale of our partial interest in Fuji Xerox and recurring
losses in low tax jurisdictions. The gain for tax purpos-
es on the sale of Fuji Xerox was disproportionate to
the gain for book purposes as a result of a lower tax
basis in the investment. Other items favorably impact-
ing the tax rate included a tax audit resolution of
approximately $140 million and additional tax benefits
arising from prior period restructuring provisions.
Our consolidated effective income tax rate will
change based on discrete events (such as audit settle-
ments) as well as other factors including the geo-
graphical mix of income before taxes and the related
tax rates in those jurisdictions. We anticipate that our
2004 annual consolidated effective tax rate will
approximate 40 percent.
Equity in Net Income of Unconsolidated Affiliates:
Equity in net income of unconsolidated affiliates is
principally related to our 25 percent share of Fuji Xerox
income. Our 2003 equity in net income of $58 million
was comparable with 2002 and 2001 results of $54 mil-
lion and $53 million, respectively.
Recent Accounting Pronouncements: See Note 1 of
the Consolidated Financial Statements for a full
description of recent accounting pronouncements
including the respective dates of adoption and effects
on results of operations and financial condition.
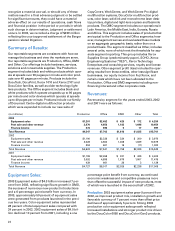
Capital Resources and Liquidity:
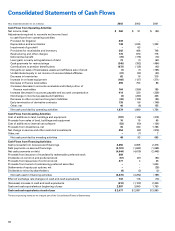
Cash Flow Analysis: The following summarizes our
cash flows for the each of the three years ended
December 31, 2003, as reported in our Consolidated
Statements of Cash Flows in the accompanying
Consolidated Financial Statements:
($ in millions) 2003 2002 2001
Net cash provided by
operating activities $1,879 $1,980 $1,754
Net cash provided by
investing activities 49 93 685
Net cash used in
financing activities (2,470) (3,292) (189)
Effect of exchange rate
changes on cash 132 116 (10)
(Decrease) increase in cash
and cash equivalents (410) (1,103) 2,240
Cash and cash equivalents
at beginning of year 2,887 3,990 1,750
Cash and cash equivalents
at end of year $2,477 $2,887 $3,990
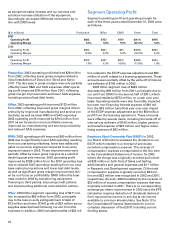
Operating: For the year ended December 31, 2003,
operating cash flows of $1.9 billion reflect pre-tax
income of $436 million and the following non-cash
items: depreciation and amortization of $748 million,
provisions for receivables and inventory of $302 mil-
lion, the provision for the Berger litigation of $239 mil-
lion and a loss on early extinguishment of debt of
$73 million. In addition, operating cash flows were
enhanced by finance receivable reductions of $496
million, cash generated from the early termination of
interest rate swaps of $136 million, accounts receiv-
able reductions of $164 million, driven by improved
collection efforts and other working capital improve-
ments of over $600 million. The Finance receivable
reduction results from collections of finance receiv-
ables associated with prior year sales that exceed
receivables generated from recent equipment sales.