Xerox 2003 Annual Report Download - page 31
Download and view the complete annual report
Please find page 31 of the 2003 Xerox annual report below. You can navigate through the pages in the report by either clicking on the pages listed below, or by using the keyword search tool below to find specific information within the annual report.-
 1
1 -
2
-
3
-
4
-
5
-
6
-
7
-
8
-
9
-
10
-
11
-
12
-
13
-
14
-
15
-
16
-
17
-
18
-
19
-
20
-
 21
21 -
 22
22 -
 23
23 -
 24
24 -
 25
25 -
 26
26 -
 27
27 -
 28
28 -
 29
29 -
 30
30 -
 31
31 -
 32
32 -
 33
33 -
 34
34 -
 35
35 -
 36
36 -
 37
37 -
 38
38 -
 39
39 -
 40
40 -
 41
41 -
42
-
43
-
44
-
45
-
46
-
47
-
48
-
49
-
50
-
51
-
52
-
53
-
54
-
55
-
56
-
57
-
58
-
59
-
60
-
61
-
62
-
63
-
64
-
65
-
66
-
67
-
68
-
69
-
70
-
71
-
72
-
73
-
74
-
75
-
76
-
77
-
78
-
79
-
80
-
81
-
82
-
83
-
84
-
85
-
86
-
87
-
88
-
89
-
90
-
91
-
92
-
93
-
94
-
95
-
96
-
97
-
98
-
99
-
100
 |
 |

29
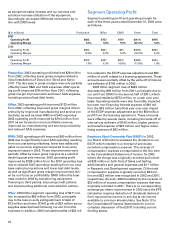
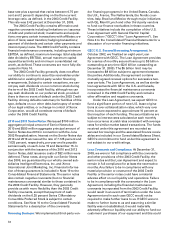
2002 non-financing interest expense was $49 mil-
lion lower than 2001 reflecting lower debt levels
throughout 2002 and lower borrowing costs in the first
half of the year, partially offset by higher interest rates
and borrowing costs in the second half of the year
associated with the terms of the 2002 Credit Facility.
Lower borrowing costs reflected the continued decline
in interest rates throughout 2002, coupled with our
higher proportion of variable rate debt in 2002 as
compared to 2001. Our 2002 credit ratings were below
investment grade and effectively constrained our abili-
ty to fully use derivative contracts to manage interest
rate risk. Accordingly, although we benefited from
lower interest rates in 2002, we had greater exposure
to volatility in our results of operations. 2002 non-
financing interest expense included net gains of
$12 million from the mark-to-market valuation of our
interest rate swaps.
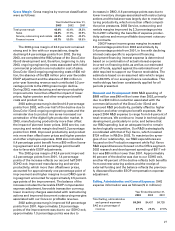
Interest income: Interest income is derived primarily
from our invested cash balances and interest resulting
from periodic tax settlements. 2003 interest income
was $12 million lower than 2002 reflecting declining
interest rates and lower average cash balances, par-
tially offset by $13 million of interest income related to
Brazilian tax credits that became realizable in 2003.
2002 interest income was lower than 2001 due to
lower invested cash balances in the second half of
2002, resulting from the payment of significant out-
standing debt as well as lower interest rates.
Net currency losses (gains): Net currency losses
(gains) result from the re-measurement of unhedged
foreign currency-denominated assets and liabilities,
the spot/forward premiums on foreign exchange for-
ward contracts in those markets where we have been
able to restore economic hedging capability and eco-
nomic hedges of anticipated transactions for which we
do not qualify for cash flow hedge accounting treat-
ment under SFAS No. 133. Beginning with the second
half 2002 and throughout 2003, we restored currency
hedging capabilities, subject to limited exceptions in
certain closed markets. This should limit remeasure-
ment gains or losses in future periods. In 2003,
exchange losses of $11 million were due largely to
spot/forward premiums on foreign exchange forward
contracts and unfavorable currency movements on
economic hedges of anticipated transactions not qual-
ifying for hedge accounting treatment.
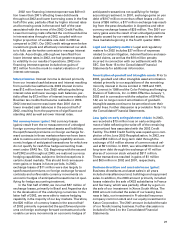
In the first half of 2002, we incurred $57 million of
exchange losses, primarily in Brazil and Argentina due
to the devaluation of the underlying currencies. In the
latter half of 2002, we were able to restore hedging
capability in the majority of our key markets. Therefore,
the $20 million of currency losses in the second half
of 2002 primarily represented the spot/forward premi-
ums on foreign exchange forward contracts and unfa-
vorable currency movements on economic hedges of
anticipated transactions not qualifying for hedge
accounting treatment. In 2001, exchange gains on yen
debt of $107 million more than offset losses on Euro
loans of $36 million, a $17 million exchange loss result-
ing from the peso devaluation in Argentina and other
currency exchange losses of $25 million. The 2001 cur-
rency gains were the result of net unhedged positions
largely caused by our restricted access to the deriva-
tives markets beginning in the fourth quarter 2000.
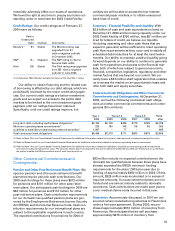
Legal and regulatory matters: Legal and regulatory
matters for 2002 includes $27 million of expenses
related to certain litigation, indemnifications and asso-
ciated claims, as well as the $10 million penalty
incurred in connection with our settlement with the
SEC. See Note 15 to the Consolidated Financial
Statements for additional information.
Amortization of goodwill and intangible assets: Prior to
2002, goodwill and other intangible asset amortization
related primarily to our acquisitions of the remaining
minority interest in Xerox Limited in 1995 and 1997,
XL Connect in 1998 and the Color Printing and Imaging
Division of Tektronix, Inc. in 2000. Effective January 1,
2002 and in connection with the adoption of SFAS No.
142, we no longer record amortization of goodwill.
Intangible assets continue to be amortized over their
useful lives. Further discussion is provided in Note 1 to
the Consolidated Financial Statements.
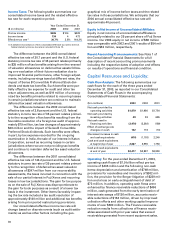
Loss (gain) on early extinguishment of debt: In 2003,
we recorded a $73 million loss on early extinguish-
ment of debt reflecting the write-off of the remaining
unamortized fees associated with the 2002 Credit
Facility. The 2002 Credit Facility was repaid upon com-
pletion of the June 2003 Recapitalization. In 2002, we
retired $52 million of long-term debt through the
exchange of 6.4 million shares of common stock val-
ued at $51 million. In 2001, we retired $374 million of
long-term debt through the exchange of 41 million
shares of common stock valued at $311 million.
These transactions resulted in gains of $1 million
and $63 million in 2002 and 2001, respectively.
Business divestiture and asset sale losses (gains):
Business divestitures and asset sales in all years
included miscellaneous land, buildings and equipment
sales. In addition, the 2003 amount primarily included
losses related to the sale of XES subsidiaries in France
and Germany, which was partially offset by a gain on
the sale of our investment in Xerox South Africa. The
2002 amount included the sales of our leasing busi-
ness in Italy, our investment in Prudential Insurance
company common stock and our equity investment in
Katun Corporation. The 2001 amount included the sale
of our Nordic leasing business. Further discussion is
included in Note 3 to the Consolidated Financial
Statements.