Western Union 2009 Annual Report Download - page 92
Download and view the complete annual report
Please find page 92 of the 2009 Western Union annual report below. You can navigate through the pages in the report by either clicking on the pages listed below, or by using the keyword search tool below to find specific information within the annual report.-
 1
1 -
2
-
3
-
4
-
5
-
6
-
7
-
8
-
9
-
10
-
11
-
12
-
13
-
14
-
15
-
16
-
17
-
18
-
19
-
20
-
21
-
22
-
23
-
24
-
25
-
26
-
27
-
28
-
29
-
30
-
31
-
32
-
33
-
34
-
35
-
36
-
37
-
38
-
39
-
40
-
41
-
42
-
43
-
44
-
45
-
46
-
47
-
48
-
49
-
50
-
51
-
52
-
53
-
54
-
55
-
56
-
57
-
58
-
59
-
60
-
61
-
62
-
63
-
64
-
65
-
66
-
67
-
68
-
69
-
70
-
71
-
72
-
73
-
74
-
75
-
76
-
77
-
78
-
79
-
80
-
81
-
 82
82 -
 83
83 -
 84
84 -
 85
85 -
 86
86 -
 87
87 -
 88
88 -
 89
89 -
 90
90 -
 91
91 -
 92
92 -
 93
93 -
 94
94 -
 95
95 -
 96
96 -
 97
97 -
 98
98 -
 99
99 -
 100
100 -
 101
101 -
 102
102 -
103
-
104
-
105
-
106
-
107
-
108
-
109
-
110
-
111
-
112
-
113
-
114
-
115
-
116
-
117
-
118
-
119
-
120
-
121
-
122
-
123
-
124
-
125
-
126
-
127
-
128
-
129
-
130
-
131
-
132
-
133
-
134
-
135
-
136
-
137
-
138
-
139
-
140
-
141
-
142
-
143
-
144
-
145
-
146
-
147
-
148
-
149
-
150
-
151
-
152
-
153
 |
 |

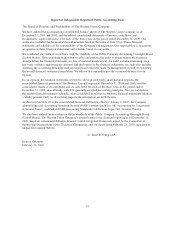
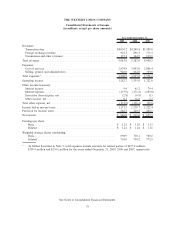
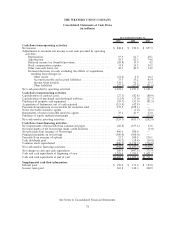
THE WESTERN UNION COMPANY
Consolidated Statements of Cash Flows
(in millions)
2009 2008 2007
Year Ended December 31,
Cash flows from operating activities
Net income ............................................... $ 848.8 $ 919.0 $ 857.3
Adjustments to reconcile net income to net cash provided by operating
activities:
Depreciation ........................................... 55.9 61.7 49.1
Amortization .......................................... 98.3 82.3 74.8
Deferred income tax (benefit)/provision ....................... (20.8) 15.9 4.2
Stock compensation expense ............................... 31.9 26.3 50.2
Other non-cash items, net ................................. 44.1 42.9 14.6
Increase/(decrease) in cash, excluding the effects of acquisitions,
resulting from changes in:
Other assets ........................................ (31.4) 6.9 16.2
Accounts payable and accrued liabilities ................... 75.5 35.2 43.4
Income taxes payable ................................. 138.3 91.2 15.3
Other liabilities ..................................... (22.5) (27.5) (21.6)
Net cash provided by operating activities ......................... 1,218.1 1,253.9 1,103.5
Cash flows from investing activities
Capitalization of contract costs ................................. (27.3) (82.8) (80.9)
Capitalization of purchased and developed software.................. (11.9) (17.0) (27.7)
Purchases of property and equipment ............................ (59.7) (53.9) (83.5)
Acquisition of businesses, net of cash acquired ..................... (515.9) (42.8) —
Proceeds from/(increase in) receivable for securities sold . . ............ 255.5 (298.1) —
Notes receivable issued to agents ............................... — (1.0) (6.1)
Repayments of notes receivable issued to agents .................... 35.2 41.9 32.0
Purchase of equity method investments ........................... — — (35.8)
Net cash used in investing activities ............................. (324.1) (453.7) (202.0)
Cash flows from financing activities
Net (repayments of)/proceeds from commercial paper ................ (82.8) (255.3) 13.6
Net repayments of net borrowings under credit facilities . . ............ — — (3.0)
Net proceeds from issuance of borrowings ........................ 496.6 500.0 —
Principal payments on borrowings............................... (500.0) (500.0) —
Proceeds from exercise of options ............................... 23.2 300.5 216.1
Cash dividends paid ......................................... (41.2) (28.4) (30.0)
Common stock repurchased ................................... (400.2) (1,314.5) (726.8)
Net cash used in financing activities ............................. (504.4) (1,297.7) (530.1)
Net change in cash and cash equivalents .......................... 389.6 (497.5) 371.4
Cash and cash equivalents at beginning of year ..................... 1,295.6 1,793.1 1,421.7
Cash and cash equivalents at end of year ......................... $1,685.2 $ 1,295.6 $1,793.1
Supplemental cash flow information:
Interest paid ............................................... $ 150.0 $ 171.6 $ 185.8
Income taxes paid .......................................... 162.8 230.3 340.9
See Notes to Consolidated Financial Statements.
78