Western Union 2009 Annual Report Download - page 50
Download and view the complete annual report
Please find page 50 of the 2009 Western Union annual report below. You can navigate through the pages in the report by either clicking on the pages listed below, or by using the keyword search tool below to find specific information within the annual report.-
 1
1 -
2
-
3
-
4
-
5
-
6
-
7
-
8
-
9
-
10
-
11
-
12
-
13
-
14
-
15
-
16
-
17
-
18
-
19
-
20
-
21
-
22
-
23
-
24
-
25
-
26
-
27
-
28
-
29
-
30
-
31
-
32
-
33
-
34
-
35
-
36
-
37
-
38
-
39
-
 40
40 -
 41
41 -
 42
42 -
 43
43 -
 44
44 -
 45
45 -
 46
46 -
 47
47 -
 48
48 -
 49
49 -
 50
50 -
 51
51 -
 52
52 -
 53
53 -
 54
54 -
 55
55 -
 56
56 -
 57
57 -
 58
58 -
 59
59 -
 60
60 -
61
-
62
-
63
-
64
-
65
-
66
-
67
-
68
-
69
-
70
-
71
-
72
-
73
-
74
-
75
-
76
-
77
-
78
-
79
-
80
-
81
-
82
-
83
-
84
-
85
-
86
-
87
-
88
-
89
-
90
-
91
-
92
-
93
-
94
-
95
-
96
-
97
-
98
-
99
-
100
-
101
-
102
-
103
-
104
-
105
-
106
-
107
-
108
-
109
-
110
-
111
-
112
-
113
-
114
-
115
-
116
-
117
-
118
-
119
-
120
-
121
-
122
-
123
-
124
-
125
-
126
-
127
-
128
-
129
-
130
-
131
-
132
-
133
-
134
-
135
-
136
-
137
-
138
-
139
-
140
-
141
-
142
-
143
-
144
-
145
-
146
-
147
-
148
-
149
-
150
-
151
-
152
-
153
 |
 |

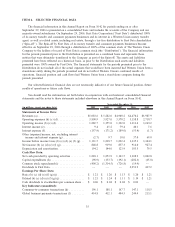
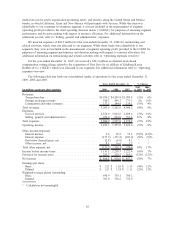
2009 2008 2007 2006 2005
As of December 31,
Balance Sheet Data:
Settlement assets........................... $2,389.1 $1,207.5 $1,319.2 $1,284.2 $ 914.4
Total assets ............................... 7,353.4 5,578.3 5,784.2 5,321.1 4,591.7
Settlement obligations ....................... 2,389.1 1,207.5 1,319.2 1,282.5 912.0
Total borrowings (m) ....................... 3,048.5 3,143.5 3,338.0 3,323.5 —
Total liabilities ............................ 6,999.9 5,586.4 5,733.5 5,635.9 1,779.9
Total stockholders’ equity/(deficiency)/Net
Investment in The Western Union Company (m) . . 353.5 (8.1) 50.7 (314.8) 2,811.8
(a) Revenue for the year ended December 31, 2009 included $30.8 million of revenue related to the Custom
House acquisition in September 2009.
(b) We followed the modified prospective method effective January 1, 2006, which requires all stock-based
payments to employees to be recognized in the income statement based on their respective grant date fair
values over the corresponding service periods and also requires an estimation of forfeitures when
calculating compensation expense. Stock-based compensation expense, including stock compensation
expense allocated by First Data prior to the Spin-off on September 29, 2006, and the impact of adopting
the modified prospective method, was $31.9 million, $26.3 million, $50.2 million and $30.1 million for
the years ended December 31, 2009, 2008, 2007 and 2006, respectively. Our stock-based compensation
expense in 2007 included a charge of $22.3 million related to the vesting of the remaining converted
unvested Western Union stock-based awards upon the completion of the acquisition of First Data on
September 24, 2007 by an affiliate of Kohlberg Kravis Roberts & Co.
(c) Operating expenses for the year ended December 31, 2008 included $82.9 million of restructuring and
related expenses associated with the closure of our facilities in Missouri and Texas and other
reorganization plans.
(d) Operating expenses for the year ended December 31, 2009 included an accrual of $71.0 million resulting
from an anticipated agreement and settlement, which resolves all outstanding legal issues and claims with
the State of Arizona and requires us to fund a multi-state not-for-profit organization promoting safety and
security along the United States and Mexico border, in which California, Texas and New Mexico will
participate with Arizona. The settlement agreement was signed on February 11, 2010.
(e) Interest income is attributed primarily to cash balances and loans made to several agents. In 2009 and
2008, the Company’s interest income has been impacted by a decline in interest rates. On the Spin-off
date, the Company received cash in connection with the settlement of intercompany notes with First Data
(net of certain other payments made to First Data) which significantly increased our international cash
balances.
(f) Interest expense primarily relates to debt incurred in connection with the Spin-off from First Data and the
refinancing of such debt. Interest expense has been significantly higher since September 29, 2006 due to
higher borrowings balances.
(g) Amounts were primarily recognized prior to the Spin-off and include derivative gains and losses, net,
interest income due from First Data, and the net foreign exchange effect on notes receivable from First
Data and related foreign currency swaps with First Data. Prior to the Spin-off, we did not have any
forward contracts that qualified as hedges, and therefore, the gains and losses on these contracts were
reflected in income prior to that date. On September 29, 2006, we entered into foreign currency forward
positions to qualify for cash flow hedge accounting. During the years ended December 31, 2009, 2008,
2007, 2006, and 2005, the pre-tax derivative (loss)/gain was $(2.8) million, $(6.9) million, $8.3 million,
$(21.2) million, and $45.8 million, respectively. Notes receivable from First Data affiliates and related
foreign currency swap agreements were settled in cash in connection with the Spin-off. During the years
ended December 31, 2006 and 2005, the interest income, net recognized from First Data, including the
impact of foreign exchange translation of the underlying notes, was $45.8 million and $18.4 million,
respectively.
36