Western Union 2009 Annual Report Download - page 71
Download and view the complete annual report
Please find page 71 of the 2009 Western Union annual report below. You can navigate through the pages in the report by either clicking on the pages listed below, or by using the keyword search tool below to find specific information within the annual report.-
 1
1 -
2
-
3
-
4
-
5
-
6
-
7
-
8
-
9
-
10
-
11
-
12
-
13
-
14
-
15
-
16
-
17
-
18
-
19
-
20
-
21
-
22
-
23
-
24
-
25
-
26
-
27
-
28
-
29
-
30
-
31
-
32
-
33
-
34
-
35
-
36
-
37
-
38
-
39
-
40
-
41
-
42
-
43
-
44
-
45
-
46
-
47
-
48
-
49
-
50
-
51
-
52
-
53
-
54
-
55
-
56
-
57
-
58
-
59
-
60
-
 61
61 -
 62
62 -
 63
63 -
 64
64 -
 65
65 -
 66
66 -
 67
67 -
 68
68 -
 69
69 -
 70
70 -
 71
71 -
 72
72 -
 73
73 -
 74
74 -
 75
75 -
 76
76 -
 77
77 -
 78
78 -
 79
79 -
 80
80 -
 81
81 -
82
-
83
-
84
-
85
-
86
-
87
-
88
-
89
-
90
-
91
-
92
-
93
-
94
-
95
-
96
-
97
-
98
-
99
-
100
-
101
-
102
-
103
-
104
-
105
-
106
-
107
-
108
-
109
-
110
-
111
-
112
-
113
-
114
-
115
-
116
-
117
-
118
-
119
-
120
-
121
-
122
-
123
-
124
-
125
-
126
-
127
-
128
-
129
-
130
-
131
-
132
-
133
-
134
-
135
-
136
-
137
-
138
-
139
-
140
-
141
-
142
-
143
-
144
-
145
-
146
-
147
-
148
-
149
-
150
-
151
-
152
-
153
 |
 |

obligations in accordance with applicable regulations. We do not hold investment securities for trading
purposes, and all of our investment securities are classified as available-for-sale and recorded at fair value.
Under the Payment Services Directive (“PSD”) in the European Union, we expect to have a similar portfolio
of investment securities, which we will manage in a similar manner and under similar guidelines as our
current portfolio.
Investment securities are exposed to market risk due to changes in interest rates and credit risk. We
regularly monitor credit risk and attempt to mitigate our exposure by making high quality investments,
including diversifying our investment portfolio. As of December 31, 2009, the majority of our investment
securities had credit ratings of “AA-” or better from a major credit rating agency. Our investment securities are
also actively managed with respect to concentration. As of December 31, 2009, there were no investments
with a single issuer or individual securities representing more than 10% of our investment securities portfolio.
Cash Flows from Operating Activities
During the years ended December 31, 2009, 2008 and 2007, cash provided by operating activities was
$1,218.1 million, $1,253.9 million and $1,103.5 million, respectively. Cash flows provided by operating
activities decreased from 2008 to 2009 due to lower net income, offset by working capital fluctuations in 2009
including the settlement accrual and the timing of tax payments. Cash flows provided by operating activities
increased from 2007 to 2008 due to higher net income and working capital fluctuations in 2008.
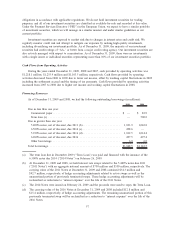
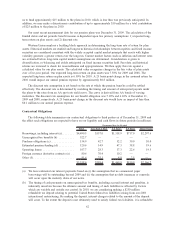
Financing Resources
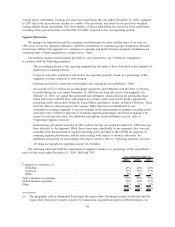
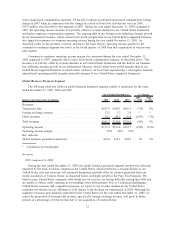
As of December 31, 2009 and 2008, we had the following outstanding borrowings (in millions):
2009 2008
Due in less than one year:
Commercial paper ........................................... $ — $ 82.9
Term loan (a) .............................................. — 500.0
Due in greater than one year:
5.400% notes, net of discount, due 2011 (b) ........................ 1,033.9 1,042.8
6.500% notes, net of discount, due 2014 (c) ........................ 498.6 —
5.930% notes, net of discount, due 2016 (d) ........................ 1,012.5 1,014.4
6.200% notes, net of discount, due 2036 .......................... 497.5 497.4
Other borrowings............................................ 6.0 6.0
Total borrowings .............................................. $3,048.5 $3,143.5
(a) The term loan due in December 2009 (“Term Loan”) was paid and financed with the issuance of the
6.500% notes due 2014 (“2014 Notes”) on February 26, 2009.
(b) At December 31, 2009 and 2008, we held interest rate swaps related to the 5.400% notes due 2011
(“2011 Notes”) with an aggregate notional amount of $750 million and $550 million, respectively. The
carrying value of the 2011 Notes at December 31, 2009 and 2008 contained $34.3 million and
$42.7 million, respectively, of hedge accounting adjustments related to active swaps as well as the
unamortized portion of previously terminated swaps. These hedge accounting adjustments will be
reclassified as reductions to “interest expense” over the life of the 2011 Notes.
(c) The 2014 Notes were issued on February 26, 2009 and the proceeds were used to repay the Term Loan.
(d) The carrying value of the 2016 Notes at December 31, 2009 and 2008 included $12.8 million and
$15.4 million, respectively, of hedge accounting adjustments. The remaining unamortized portion of this
previously terminated swap will be reclassified as a reduction to “interest expense” over the life of the
2016 Notes.
57