Western Union 2009 Annual Report Download - page 139
Download and view the complete annual report
Please find page 139 of the 2009 Western Union annual report below. You can navigate through the pages in the report by either clicking on the pages listed below, or by using the keyword search tool below to find specific information within the annual report.-
 1
1 -
2
-
3
-
4
-
5
-
6
-
7
-
8
-
9
-
10
-
11
-
12
-
13
-
14
-
15
-
16
-
17
-
18
-
19
-
20
-
21
-
22
-
23
-
24
-
25
-
26
-
27
-
28
-
29
-
30
-
31
-
32
-
33
-
34
-
35
-
36
-
37
-
38
-
39
-
40
-
41
-
42
-
43
-
44
-
45
-
46
-
47
-
48
-
49
-
50
-
51
-
52
-
53
-
54
-
55
-
56
-
57
-
58
-
59
-
60
-
61
-
62
-
63
-
64
-
65
-
66
-
67
-
68
-
69
-
70
-
71
-
72
-
73
-
74
-
75
-
76
-
77
-
78
-
79
-
80
-
81
-
82
-
83
-
84
-
85
-
86
-
87
-
88
-
89
-
90
-
91
-
92
-
93
-
94
-
95
-
96
-
97
-
98
-
99
-
100
-
101
-
102
-
103
-
104
-
105
-
106
-
107
-
108
-
109
-
110
-
111
-
112
-
113
-
114
-
115
-
116
-
117
-
118
-
119
-
120
-
121
-
122
-
123
-
124
-
125
-
126
-
127
-
128
-
 129
129 -
 130
130 -
 131
131 -
 132
132 -
 133
133 -
 134
134 -
 135
135 -
 136
136 -
 137
137 -
 138
138 -
 139
139 -
 140
140 -
 141
141 -
 142
142 -
 143
143 -
 144
144 -
 145
145 -
 146
146 -
 147
147 -
 148
148 -
 149
149 -
150
-
151
-
152
-
153
 |
 |

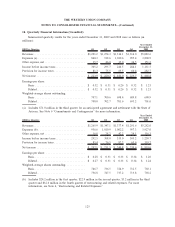
18. Quarterly Financial Information (Unaudited)
Summarized quarterly results for the years ended December 31, 2009 and 2008 were as follows (in
millions):
2009 by Quarter: Q1 Q2 Q3 Q4
Year Ended
December 31,
2009
Revenues ................................. $1,201.2 $1,254.3 $1,314.1 $1,314.0 $5,083.6
Expenses (a) .............................. 860.3 912.6 1,032.6 995.4 3,800.9
Other expense, net .......................... 35.7 46.0 35.0 34.5 151.2
Income before income taxes ................... 305.2 295.7 246.5 284.1 1,131.5
Provision for income taxes .................... 81.3 75.5 65.5 60.4 282.7
Net income ............................... $ 223.9 $ 220.2 $ 181.0 $ 223.7 $ 848.8
Earnings per share:
Basic ................................ $ 0.32 $ 0.31 $ 0.26 $ 0.32 $ 1.21
Diluted ............................... $ 0.32 $ 0.31 $ 0.26 $ 0.32 $ 1.21
Weighted-average shares outstanding:
Basic ................................ 707.1 700.6 698.4 689.8 698.9
Diluted ............................... 708.0 702.7 701.6 693.2 701.0
(a) Includes $71.0 million in the third quarter for an anticipated agreement and settlement with the State of
Arizona. See Note 6 “Commitments and Contingencies” for more information.
2008 by Quarter: Q1 Q2 Q3 Q4
Year Ended
December 31,
2008
Revenues ................................. $1,265.9 $1,347.1 $1,377.4 $1,291.6 $5,282.0
Expenses (b) .............................. 956.6 1,010.9 1,002.2 957.3 3,927.0
Other expense, net .......................... 16.8 28.2 42.2 29.1 116.3
Income before income taxes ................... 292.5 308.0 333.0 305.2 1,238.7
Provision for income taxes .................... 85.4 76.5 92.2 65.6 319.7
Net income ............................... $ 207.1 $ 231.5 $ 240.8 $ 239.6 $ 919.0
Earnings per share: .........................
Basic ................................ $ 0.28 $ 0.31 $ 0.33 $ 0.34 $ 1.26
Diluted ............................... $ 0.27 $ 0.31 $ 0.33 $ 0.34 $ 1.24
Weighted-average shares outstanding: ............
Basic ................................ 746.7 736.5 724.9 712.5 730.1
Diluted ............................... 756.8 747.5 737.2 713.8 738.2
(b) Includes $24.2 million in the first quarter, $22.9 million in the second quarter, $3.2 million in the third
quarter and $32.6 million in the fourth quarter of restructuring and related expenses. For more
information, see Note 4, “Restructuring and Related Expenses.”
125
THE WESTERN UNION COMPANY
NOTES TO CONSOLIDATED FINANCIAL STATEMENTS—(Continued)