Western Union 2009 Annual Report Download - page 140
Download and view the complete annual report
Please find page 140 of the 2009 Western Union annual report below. You can navigate through the pages in the report by either clicking on the pages listed below, or by using the keyword search tool below to find specific information within the annual report.-
 1
1 -
2
-
3
-
4
-
5
-
6
-
7
-
8
-
9
-
10
-
11
-
12
-
13
-
14
-
15
-
16
-
17
-
18
-
19
-
20
-
21
-
22
-
23
-
24
-
25
-
26
-
27
-
28
-
29
-
30
-
31
-
32
-
33
-
34
-
35
-
36
-
37
-
38
-
39
-
40
-
41
-
42
-
43
-
44
-
45
-
46
-
47
-
48
-
49
-
50
-
51
-
52
-
53
-
54
-
55
-
56
-
57
-
58
-
59
-
60
-
61
-
62
-
63
-
64
-
65
-
66
-
67
-
68
-
69
-
70
-
71
-
72
-
73
-
74
-
75
-
76
-
77
-
78
-
79
-
80
-
81
-
82
-
83
-
84
-
85
-
86
-
87
-
88
-
89
-
90
-
91
-
92
-
93
-
94
-
95
-
96
-
97
-
98
-
99
-
100
-
101
-
102
-
103
-
104
-
105
-
106
-
107
-
108
-
109
-
110
-
111
-
112
-
113
-
114
-
115
-
116
-
117
-
118
-
119
-
120
-
121
-
122
-
123
-
124
-
125
-
126
-
127
-
128
-
129
-
 130
130 -
 131
131 -
 132
132 -
 133
133 -
 134
134 -
 135
135 -
 136
136 -
 137
137 -
 138
138 -
 139
139 -
 140
140 -
 141
141 -
 142
142 -
 143
143 -
 144
144 -
 145
145 -
 146
146 -
 147
147 -
 148
148 -
 149
149 -
 150
150 -
151
-
152
-
153
 |
 |

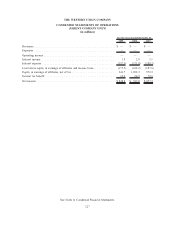
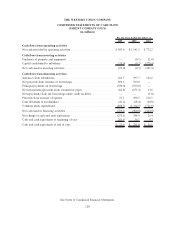
THE WESTERN UNION COMPANY
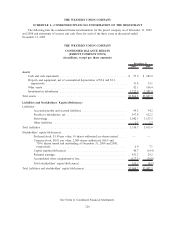
SCHEDULE I—CONDENSED FINANCIAL INFORMATION OF THE REGISTRANT
The following lists the condensed financial information for the parent company as of December 31, 2009
and 2008 and statements of income and cash flows for each of the three years in the period ended
December 31, 2009.
THE WESTERN UNION COMPANY
CONDENSED BALANCE SHEETS
(PARENT COMPANY ONLY)
(in millions, except per share amounts)
2009 2008
December 31,
Assets
Cash and cash equivalents .......................................... $ 27.9 $ 281.0
Property and equipment, net of accumulated depreciation of $9.4 and $3.1,
respectively ................................................... 31.8 33.1
Other assets ..................................................... 82.1 106.4
Investment in subsidiaries ........................................... 3,722.4 3,387.0
Total assets ......................................................... $3,864.2 $3,807.5
Liabilities and Stockholders’ Equity/(Deficiency)
Liabilities:
Accounts payable and accrued liabilities ............................ 69.3 54.2
Payable to subsidiaries, net ...................................... 397.4 622.2
Borrowings .................................................. 3,042.5 3,137.5
Other liabilities ............................................... 1.5 1.7
Total liabilities . ..................................................... 3,510.7 3,815.6
Stockholders’ equity/(deficiency):
Preferred stock, $1.00 par value; 10 shares authorized; no shares issued . . . . . — —
Common stock, $0.01 par value; 2,000 shares authorized; 686.5 and
709.6 shares issued and outstanding at December 31, 2009 and 2008,
respectively ................................................ 6.9 7.1
Capital surplus/(deficiency) ...................................... 40.7 (14.4)
Retained earnings ............................................. 433.2 29.2
Accumulated other comprehensive loss ............................. (127.3) (30.0)
Total stockholders’ equity/(deficiency) .............................. 353.5 (8.1)
Total liabilities and stockholders’ equity/(deficiency) .......................... $3,864.2 $3,807.5
See Notes to Condensed Financial Statements.
126