Western Union 2009 Annual Report Download - page 134
Download and view the complete annual report
Please find page 134 of the 2009 Western Union annual report below. You can navigate through the pages in the report by either clicking on the pages listed below, or by using the keyword search tool below to find specific information within the annual report.-
 1
1 -
2
-
3
-
4
-
5
-
6
-
7
-
8
-
9
-
10
-
11
-
12
-
13
-
14
-
15
-
16
-
17
-
18
-
19
-
20
-
21
-
22
-
23
-
24
-
25
-
26
-
27
-
28
-
29
-
30
-
31
-
32
-
33
-
34
-
35
-
36
-
37
-
38
-
39
-
40
-
41
-
42
-
43
-
44
-
45
-
46
-
47
-
48
-
49
-
50
-
51
-
52
-
53
-
54
-
55
-
56
-
57
-
58
-
59
-
60
-
61
-
62
-
63
-
64
-
65
-
66
-
67
-
68
-
69
-
70
-
71
-
72
-
73
-
74
-
75
-
76
-
77
-
78
-
79
-
80
-
81
-
82
-
83
-
84
-
85
-
86
-
87
-
88
-
89
-
90
-
91
-
92
-
93
-
94
-
95
-
96
-
97
-
98
-
99
-
100
-
101
-
102
-
103
-
104
-
105
-
106
-
107
-
108
-
109
-
110
-
111
-
112
-
113
-
114
-
115
-
116
-
117
-
118
-
119
-
120
-
121
-
122
-
123
-
 124
124 -
 125
125 -
 126
126 -
 127
127 -
 128
128 -
 129
129 -
 130
130 -
 131
131 -
 132
132 -
 133
133 -
 134
134 -
 135
135 -
 136
136 -
 137
137 -
 138
138 -
 139
139 -
 140
140 -
 141
141 -
 142
142 -
 143
143 -
 144
144 -
145
-
146
-
147
-
148
-
149
-
150
-
151
-
152
-
153
 |
 |

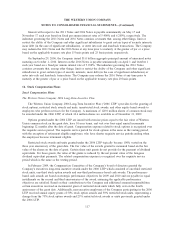
Stock-Based Compensation
The following table sets forth the total impact on earnings for stock-based compensation expense
recognized in the Consolidated Statements of Income resulting from stock options, restricted stock awards and
restricted stock units for the years ended December 31, 2009, 2008 and 2007 (in millions, except per share data).
2009 2008 2007
Year Ended December 31,
Stock-based compensation expense ............................ $(31.9) $(26.3) $(50.2)
Income tax benefit from stock-based compensation expense .......... 9.9 7.7 15.1
Net income impact ........................................ $(22.0) $(18.6) $(35.1)
Earnings per share:
Basic............................................... $(0.03) $(0.03) $(0.05)
Diluted ............................................. $(0.03) $(0.03) $(0.05)
As discussed previously, the Company incurred a pre-tax charge of $22.3 million during the year ended
December 31, 2007 upon the completion of the acquisition of First Data on September 24, 2007 by an affiliate
of KKR.
As of December 31, 2009, there was $31.0 million of total unrecognized compensation cost, net of
assumed forfeitures, related to non-vested stock options which is expected to be recognized over a weighted-
average period of 2.4 years, and there was $18.0 million of total unrecognized compensation cost, net of
assumed forfeitures, related to non-vested restricted stock awards and restricted stock units which is expected
to be recognized over a weighted-average period of 2.1 years.
Fair Value Assumptions
The Company used the following assumptions for the Black-Scholes option pricing model to determine
the value of Western Union options granted.
2009 2008 2007
Year Ended December 31,
Stock options granted:
Weighted-average risk-free interest rate ........................... 2.0% 3.0% 4.5%
Weighted-average dividend yield ................................ 0.2% 0.2% 0.2%
Volatility ................................................. 46.3% 31.8% 23.8%
Expected term (in years) . ..................................... 5.6 5.9 6.2
Weighted-average grant date fair value ........................... $5.41 $7.57 $7.35
Expected volatility—For the Company’s board of directors and executives, the expected volatility for the
2009, 2008 and 2007 grants was 46.9%, 31.3% and 26.9%, respectively. The expected volatility for the
Company’s non-executive employees was 46.0%, 31.9% and 22.8% for the 2009, 2008 and 2007 grants,
respectively. In 2009 and 2008, Western Union used a blend of implied and historical volatility. The
Company’s implied volatility was calculated using the market price of traded options on Western Union’s
common stock. In 2009, the historical volatility represented a blend of Western Union and First Data (prior to
the Spin-off) stock data. In 2008, the historical volatility also included a peer group of companies in similar
industries and/or market capitalizations. In 2007, Western Union’s volatility was determined based entirely on
the calculated peer group historical volatility since there was not sufficient trading history for Western Union’s
common stock or traded options.
Expected dividend yield—The Company’s expected annual dividend yield is the calculation of the
annualized Western Union dividend divided by a rolling 12 month average Western Union stock price on each
120
THE WESTERN UNION COMPANY
NOTES TO CONSOLIDATED FINANCIAL STATEMENTS—(Continued)